|
|
|
|
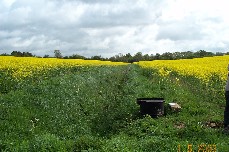
Completed Fieldwork: Field A
|
|
|
|
[Description]Monitoring[Preliminary Results]
|
|
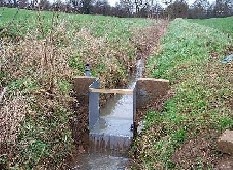
Continuous monitoring of ditch water levels was conducted using constructed flumes with pressure transducers inserted into adjacent pipes. The pressure transducers monitor the height of a water column (by measuring water pressure) and also groundwater temperature.
Flumes were
located at upstream and downstream positions in the ditch to establish inflow
and outflow from the field to generate a water and nutrient balance, for modelling
purposes
Water levels in multi level piezometers adjacent to the ditch were measured and a
rain gauge was installed giving continuous rainfall data.
|
|
|
|
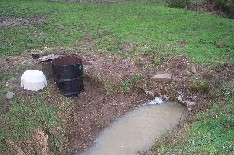
A field drain enters the ditch, located in a
topographic hollow. This hollow was identified as a potential CSA, so
capacitance probe (soils moisture) and multi-level piezometers were installed
here.
Field experiments were designed to define the risk of contaminant transport where hydrological connectivity between land, stream and groundwater exists.
Instrumentation includes multi-depth TDR, 27 multi-depth piezometers and zero-tension sampler nests, together with surface runoff collectors. |
|
Piezometers installed across the field:
3x
multi-level 1, 2 & 3m piezometers going up the gradient adjacent to the
ditch and hollow.
3m
upslope and down-slope logging piezometers, with pressure transducers measuring
water temperature and water level.
1
& 2m piezometers spread around the field, for a spatial dimension
Sampling for water quality analysis was performed along the ditch and selected piezometers across the site. High resolution sampling was also undertaken during rainfall events.
|
 |
|
|
Soil
samples and soil cores were taken to establish the temporal and spatial
variations of soil nutrients and the movement of P and N within the soil, both
horizontally and vertically.
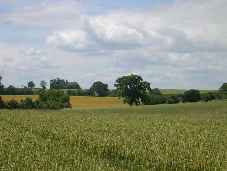
A
field survey was carried out in November 2001, using the latest techniques in GPS.
3- D visualisation along with hydro-chemical data identifies possible areas of Critical Source Areas (CSAs). The maps constructed are used in flow connectivity modelling.
|
Back to top of page
|
|
|
©
University of Sheffield, University of Newcastle upon Tyne & Lancaster University 2001, 2004 and 2005
Last
updated March 2005

|