|
Completed Fieldwork: Field A
|
|
|
[Description][Monitoring]Preliminary Results
|
|
A.
Ground water depth
Pressure transducers were installed to log water depth in two 3m piezometers.
Figure 1 shows a sustained period of rainfall between 25th and 29th January,
2002. Twenty four hours elapsed between the peak in rainfall and the shallowest
water depth in the upslope piezometer. This indicates the slow response of the
system and the dominance of subsurface flow in the catchment response to
rainfall.
The down slope piezometer showed no response to rainfall, indicating a lack
of subsurface flow connectivity to the ditch in this location.
|
Figure 1. The response of water depth to rainfall. 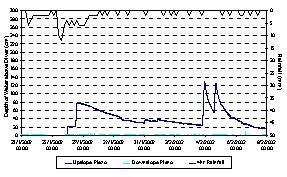 click on the graph above for a larger version click on the graph above for a larger version
|
| B.
Ditch water depth
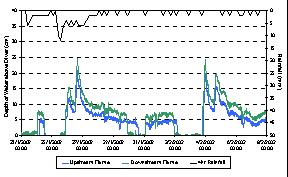
Figure 2. The
response of water depth in the ditch to rainfall.
 click on the graph above for a larger version
|
Pressure transducers were installed to log water depth
in two flumes located at upstream and downstream points on the ditch. As shown
in Figure 2 ,in response to the sustained period of rainfall between 25th and 29th January,
2002, both flumes showed peak flow 24 hours peak rainfall. This again shows the
slow response of the system to rainfall and the dominance of subsurface flow.
The increased water depth a the downstream flume may indicate the input of water
from field A.
|
|
C.
Soil moisture
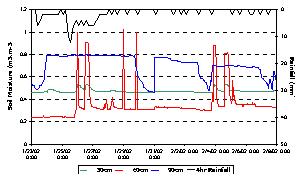
Three capacitance probes were installed adjacent to the
ditch, the measure soil moisture is shown in Figure 3. The deepest
probe (90cm) showed generally high soil moisture content, with drying in low
rainfall periods. Soil moisture leveled off at ~0.8m3 m-3,
indicative of saturation during prolonged rainfall. The probe may have been
below the water table, suggesting a perched water table when compared to the
adjacent 3m logged piezometers (Figure 1). The probe at 60cm depth showed a
rapid increase in soil moisture in response to rainfall, indicating a rapid
vertical flux and possible macropore flow. The near surface (30cm) probe,
situated in a clay-rich layer, showed limited response to rainfall with a
base level of increased soil moisture, in comparison to 60cm. |
Figure 3. Soil moisture at 30, 60 and 90cm depth.
 click on the graph above for a larger version
|
D.
Soil nutrient chemistry
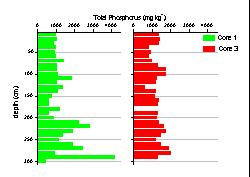
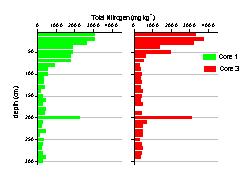
Figure 4. Total phosphorus concentration variation with depth.
|
The nutrient concentrations in two soils cores were analysed, the results fro
total phosphorus and total nitrogen are shown in Figure 4 and 5. Total
phosphorus concentrations shows a relatively constant value with depth in core 3
and an overall increase in core 1. In eight other locations in the field both an
increase and decrease with increasing depth were observed.
|
Figure 5 shows a decline in total nitrogen with increasing depth. This was
repeated across Field A at eight other locations, where total nitrogen
concentration was significantly at the soil surface in comparison to 1m and
2m depths. |
Figure 5. Total nitrogen concentration variation with depth.
|
E.
Soil water nutrient chemistry
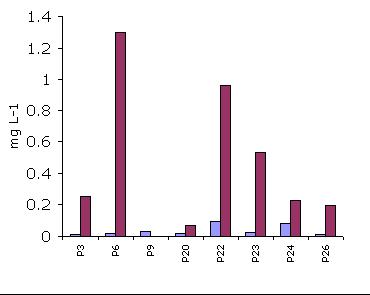
Figure 6. Phosphorus concentration in sampled piezometers
click on the graph above for a larger version
|
The phosphorus concentration in water sampled from selected piezometers
(02/11/02) is shown in Figure 6. Dissolved reactive phosphorus (DRP) ranged from
0.010 mgL-1 to 0.900 mgL-1 and total phosphorus (TP) from 0.069
mgL-1 to 1.298 mgL-1. This indicates that the majority (mean
88.5%) of phosphorus is present in particulate or particulate associated forms. In
comparison to the nutrient concentrations in the piezometers observed in January 2002 dissolved phosphorus
concentrations had increased by on average 56.6%, nitrate however only increased by 7.4%. This suggests that phosphorus is slowly transported from the surface into soil and ground water after the
application of biosolids, in comparison to nitrate, which is readily soluble and mobile.
The results shown in Figure 6 highlight
the range of variation in P concentrations across the 14 site and the relatively small concentration range for the DRP fraction in
comparison with TP. The DRP concentrations recorded in the piezometers were
consistently below 0.1 mg l-1. The TP concentrations, however,
exceeded 1 mg l-1 at one location, with the majority of samples
demonstrating TP concentrations above 0.2 mg l-1.The elevated TP and DRP in the piezometers indicate a source of P,
however, the 20 meter unsaturated zone will
significantly reduce the connectivity to the groundwater and it is anticipated
that P sorption may limit transfer to groundwater unless hydrological conditions
change, i.e. the unsaturated zone is reduced.
|
|
F.
Surface water nutrient chemistry
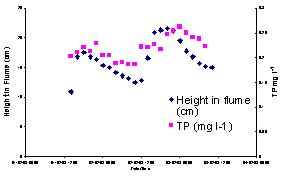
Figure 7 shows the relationship between TP
and height of water in the flume over a three day period (1/02/03 to 04/02/03)
where water height was collected at 10 minute intervals and TP samples
collected at 2 hourly intervals. It
suggests that as ditch flow increases it coincides with a corresponding
increase in TP with TP values ranging from 0.036 to 0.262 mg l -1.
|
Figure 7. The relationship of TP to ditch water depth
|
|
G.
Field A Summary
Data analysis suggest that the field
site:
1. Is a groundwater dominated system
2. Has a slow response to sustained rainfall
3. Evidence indicates vertical subsurface flux dominates
4. Little evidence of overland flow from hollow to ditch
5. Subsurface connectivity between hill slopes and ditch spatially limited
6. Heterogeneity due to sand zones and layers
7. Pre-sludge application analysis showed a wide range of P and N concentrations over the site. This variability was reduced after sludge application, suggesting nutrient transport in some areas.
Back to top of page
|