DETERMINING THE BEST TRACK PERFORMANCE FOR ALL TIME
19 th February, 2019.
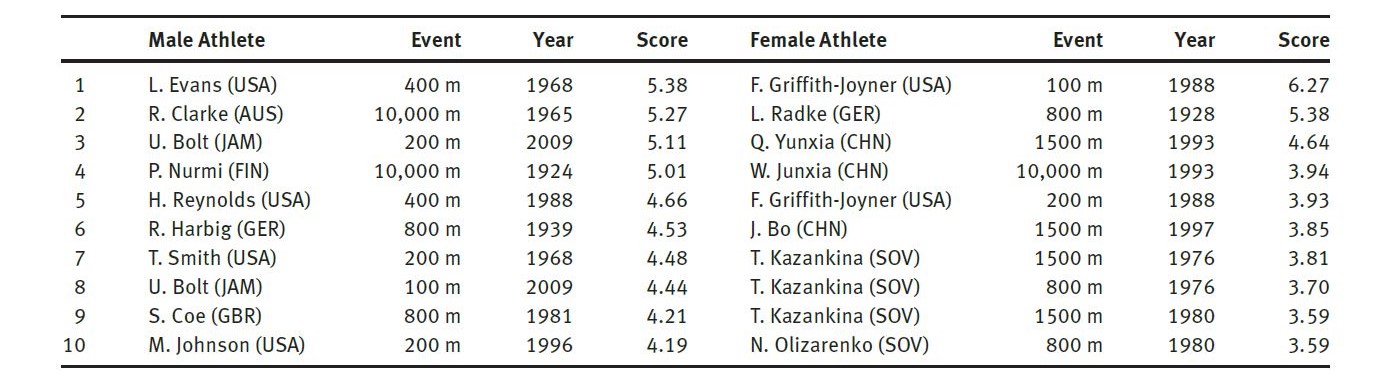
What is the best man and woman athletics performance in running when we have data about the annual best times taken in seven Olympic distances events (100 m, 200 m, 400 m, 800 m, 1500 m, 5000 m and 10000 m) for both male and female athletics? Extreme value theory would be very useful to give the answer to this question.
From athletics records, the interest lies in the fastest times taken by athletes, or the minima, which gives more information that only world records because it even includes fast performances that not actually record breaking, then more accurate conclusion can be obtainable.
Since \( \min \{X_1, …, X_n\} = - \max\{X_1, …, X_n\}\), all results holding for the maximum of the sample still hold for the minimum value.
Therefore, assume that \( X \sim \text{GEV} (\mu, \sigma, \xi) \) which is commonly used to model data that consists of maxima/minima
from some process.
$$ G(x) = 1 - \exp \left[ -\{ 1 - \xi(x - \mu)/\sigma\}_+^{-1/\xi} \right],$$
where \( \mu, \xi \in \mathbb{R}, \sigma >0, h_+ = \max\{0,h\}\).
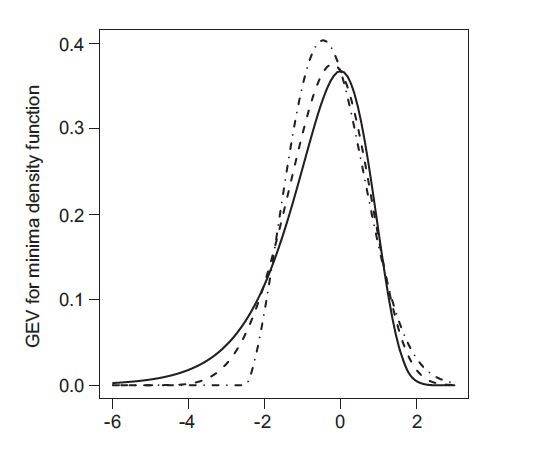
Looking at the graph of the standardised GEV distribution with 3 different shape parameter
\( \xi =0, \xi =-0.2, \xi = -0.4\), which are in the range likely to be obtained for athletics data.
The fastest times corresponds to the behaviour of lower tail.
It can be seen that the annual best times typically reduce linearly over a period of time and then levelling off. It is quite easily understood because of the improvement in all aspects of life over time, particularly faster changing speed in the 20s century and then more slowly until now. Therefore, Alec G. Stephenson and Jonathan A. Tawn suggests the location of distribution can be expressed as exponential function over time and a linear decay is a special case of the proposed model.
Moreover, they saw that the variation \( \sigma/\mu \) constant over time and only changes over distance, which is very important to reduce the number of parameters in their first proposed model.
Therefore, it is necessary to expand the model to take account of factors that affects the annual best times such as major events , for example during Second World War, the use of drugs, or the popularity of athletic participation, etc.
Alec G. Stephenson and Jonathan A. Tawn introduce the proportion of a conceptual population of size n in race distance d in year t into the new model. Note that when that proportion is equal to 1, the model now will become the previous model.
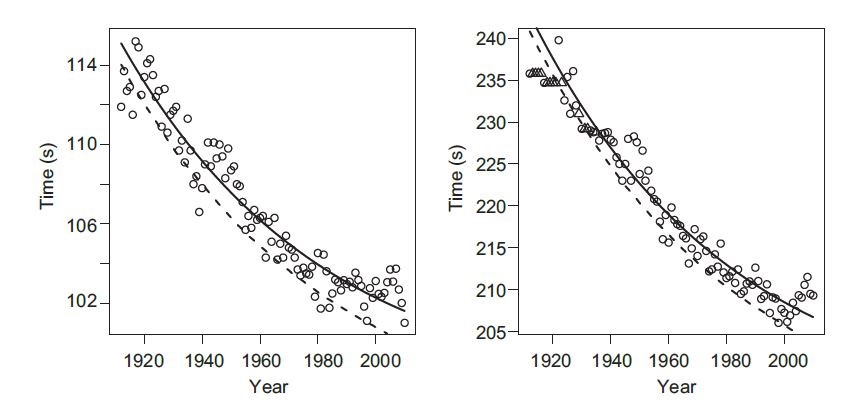
To investigate the fitted GEV models of time records over years, Alec G. Stephenson and Jonathan A. Tawn has used Bayesian inference with improper flat priors for both parameters and the logarithmic transform of the parameters and then, produced Markov chains for a number of alternative models to female and male data separately. After that the deviance information criteria value can be obtainable from the Markov chain with lower values within each gender represent better fitting models. After considering various alternative models, Alec G. Stephenson and Jonathan A. Tawn came up with 2 fitted model for each gender separately.
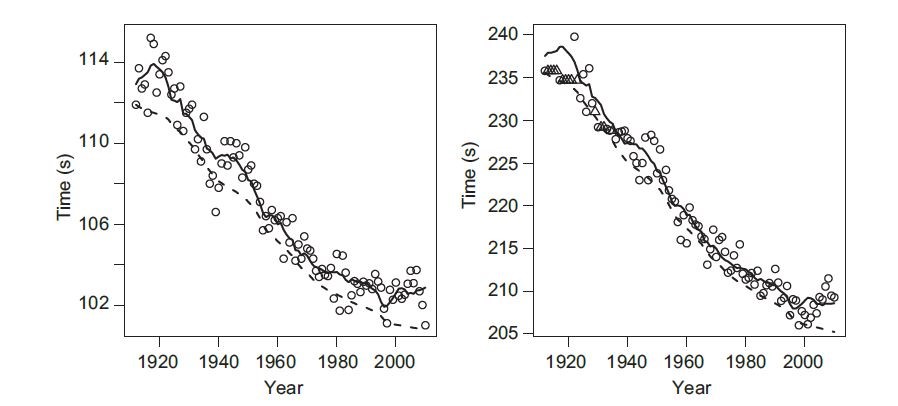
In the following 2 figures, solid lines shows the expected annual best times for distance 800 m and 1500 m events from the fitted model. It is not a smooth curve, but captures the data better. This 2 figures also includes dashed lines representing the world record times from the fitted model by simulation.
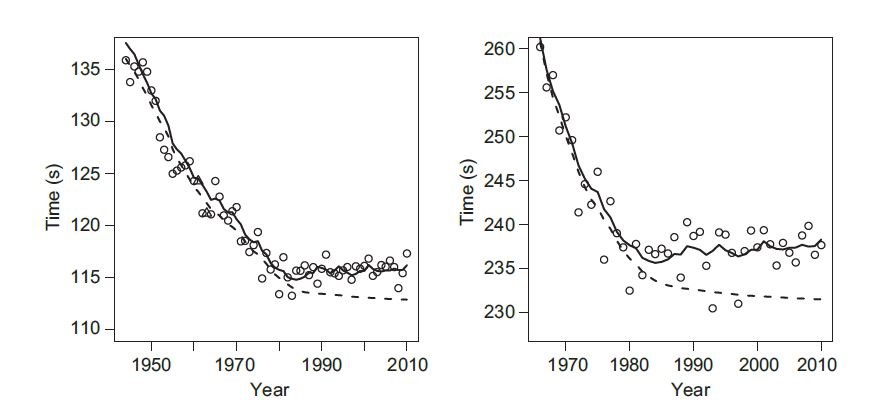
In conclusion, the fitted model provide a good fit to the data and simultaneously rank performances over both time and event distance even though there is some arguments that comparison performances over different distance races is not reasonable. However, this approach can not tackle the aim of the author which is to identify the best performances across all distances over times. To get more detail about this article, please find the reference below.
Reference:
1. Determining the Best Track Performances of All Time Using a Conceptual Population Model for Athletics Records, Alec G. Stephenson and Jonathan A.Tawn.