INFINITE SERVER QUEUES IN HEALTHCARE
26 th February, 2019.
Queuing model is a utilized (useful) tool to predict levels of congestion, then develop more rules for bed allocation and staffing, and identify other opportunities to improve services. Moreover, queuing analysis can be very valuable to estimate requirement capacity for possible future scenarios, for instances demand surges due to new diseases. But the critical issues are data requirements, model choice, model-building and their result’s interpretation.
The provision of a high quality and on time service is a significant target in the health care sector. Healthcare is full with delays. Most of us have to wait for days or weeks or even months to get an appointment with a physician, nurse, or doctor … and upon arrival we must wait some more until being served. This is due to the problems that many healthcare facilities are facing are the growing and varying demands, different types of patient (in case of emergency) and tightly constrained resources. However, in fact, there can be waste of resources in elsewhere or at particular time, like overstaff, unused beds available, etc. The crucial question to tackle now is how can we utilize resources (staffing) in the most cost-effective way to reduce delays, number of cancellations or staff hour at time when the demand is low. There are many factors to assess the performance measure such as reducing waiting times of patients, reducing the number of cancellations or rescheduling staff working hours at times when the demand is low. One measure way is to achieve the government target for A&E departments: “98% (now 95%) of patients finish their journey (discharged or be admitted to hospital) in 4 hours”.
To find out how to make changes to the system it would be great to understand about the underlying processes driving the system. A department of a hospital is actually a complex network of different services through which patients could have many different pathways. Moreover, the arrival rates of patients and the number of staff also often change in time. Queueing models can help us have a better insight into analysing the fundamental behaviour of these systems.
So why are we interested in infinite server queueing models in particular? Clearly, in the real world, there would never be an infinite amount of servers. Nevertheless, it uses infinite server networks to calculate the time dependent workload imposed on each type of medical staff. Moreover, in infinite server networks, customers will not interact with each other.
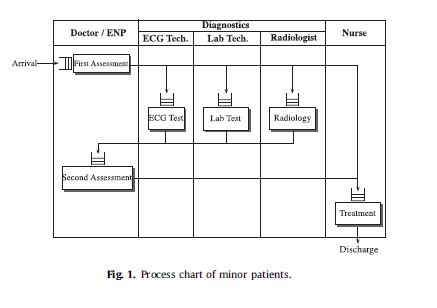
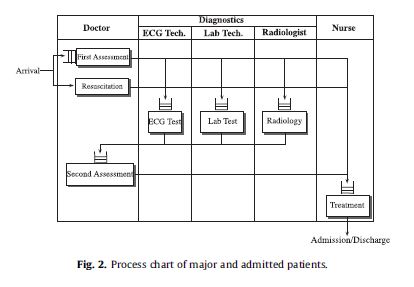
There are 3 types of patients (minor, major and admitted) and 6 types of medical staff in the model. Admitted type of patients are assumed to be admitted to a hospital, whereas major patients are discharged home after some diagnostic test by a doctor and some treatments by a nurse. Obviously, there are some small percentage of admitted and major patients with the severe conditions, who are put in a resuscitation room. Note that, all minor patients are discharged home. The following process charts show the pathway each patient type goes through and the corresponding resources, from which you can see where to form a queue (in front of each task except for emergency case).
Izady and Worthington (2012) addressed the problem of finding the require number of each type of staff in an A&E department to meet the 4-hour sojourn time target. The simple idea is to allocate resources per staffing interval, which refers to the period during which the number of staff remains constant, approximately proportionate to the corresponding average arrival rate, which not matches the capacity with the actual workloads. Instead, Izady and Worthington (2012) have combined non-stationary infinite server networks, the square root staffing law and simulation for a heuristic iterative approach to estimate the size and timing of the workloads on all types of resources in the system to stabilize the quality of services delivered by all emergency care providers at all times.
The square root staffing law for single service queues is built by Jennings et all. (1996) using the maximum offered load over each interval to ensure maintaining the targeted service level at all times and Izady and Worthington (2012) will extend it to network of services.
Based on the square root staffing law while achieving a target delay probability across all service stations at all times, the number of staff required at time t is
$$s(t) = \lceil m_{\infty}^k(t) + \beta \sqrt{ m_{\infty}^k(t) }\rceil ,$$ where \(\beta\) is a quality of service parameter according to the time-stable delay probabilities at all resource types \(\alpha\).
The time dependent maximum offered load \(m_{\infty}^k(t)\) is estimated by the mean number of busy servers of resource type k in the corresponding \((M_t/G/\infty)^K/M \) queueing network with the same arrival and service processes, routing processes as the original queueing system but with infinite servers of all K types of resources. (see Massey and Whitt (1993)).
The basic staffing algorithm is outlined below
Step 1: Set \(\alpha = 1.0\) and calculate \(m_{\infty+y}^k(t)\). For knowing how to calculate it, please find the reference below.
Step 2: Finding \(\beta\) according to \(\alpha\).
Step 3: For each type k of resource, finding the staffing levels \(s_k(t)\) of all staffing intervals.
Step 4: estimating the percentage discharged within 4 hours using simulation.
Step 5: If the percentage discharged is less (more) than \(98 \%\) (now \(95\%\)) decrease (increase) \(\alpha\) and return step 2.
Otherwise stop and return the staffing function.
The author has extracted information through 7-day survey in 12 hospitals based on three simple 8-hour shifts and got that \(57\% , 19\%, 24 \%\) of total patients are minor, major and admitted patients. By simulating the system over 100 weeks, the below figure show the percentage discharged over 4 hours versus \alpha. It is clear that for in order to obtain the \(98\%\) discharge target, each type of resource needs to be staffed according to a delay probability of \(75\%\).
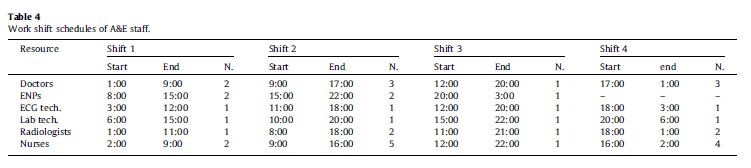
Applying to the data through the 7 days surveys under 12 hospital, here is the table of work shift schedules:
For the possibility of applying the approach for other emergency department, the proposed model is still quite general and has made some assumptions. Izady and Worthington (2012) recommend to use the method once for every season because the arrival pattern might change significantly to produce new profiles.
The feasibility of the staffing profiles and the shift pattern is a major issue in practical, when producing staff ‘ rosters. If the rostering system cannot find any feasible solution by the proposed method, requirements further changes need to be made in the model. However, this hierarchical approach may end up in sub-optimal solutions. Therefore it would be challenging yet useful to extend the approach to networks of services and meet roster requirements.
Reference:
1. Setting staffing requirements for time dependent queueing networks: The case of accident and emergency departments, Navid Izady, Dave Worthington, European Journal of Operational Research Volume 219, Issue 3, 16 June 2012, Pages 531-540
2. Massey, William A. and Whitt, Ward, Networks of infinite-server queues with nonstationary Poisson input, Queueing Systems, 1993.