A different way to think about the geostatistical model is in its conditional form:
This led Diggle et al. (1998) to embed the model within the class of generalized linear mixed models (Breslow and Clayton, 1993b), to allow for example:
Poisson log-linear geostatistical models
Binary logistic-linear geostatistical models
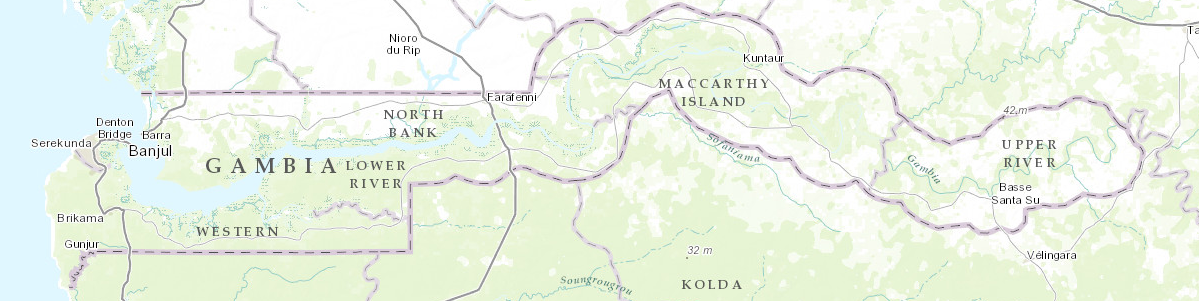
Childhood malaria in Gambia
A survey was conducted in village communities throughout Gambia (Diggle et al., 2002), see Figure 7.6.
For each child in the survey, the following information was recorded:
presence/absence of malarial parasites in blood-sample, for th child in th village
age, sex, bednet use
satellite-derived vegetation green-ness index
A logistic regression model, allowing for residual spatial variation and residual non-spatial variation between villages, is:
where and is a zero-mean stationary Gaussian process on .
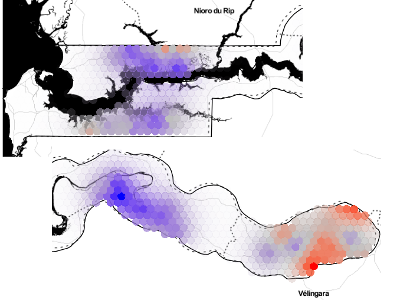
Results:
inclusion of either or term materially affects inferences about
map of against village locations suggests strong spatial structure
map of shows spatial smoothing of unexplained spatial variation in risk
Further extensions of spatial geostatistical models are often required for all but the simplest problems. The assumption of stationarity is often inappropriate, and may datasets suitable for geostatistical analysis also have a temporal dimension, for example in environmental and healthcare monitoring. Much recent research in the subject has focused on developing suitable methods to extend geostatistical methods into the spatio-temporal domain.