The real power of GIS for the Humanities is its ability to aid scholars in collecting, organising and analysing information from a wide variety of source materials.
In order to demonstrate this, we are using GIS to integrate information from major online databases–including Histpop and Bopcris (which contain hundreds of thousands of pages of historical documents, parliamentary publications and official reports)–that will help us explore changing patterns of health, disease and mortality in England and Wales during the 19c and the early 20c.
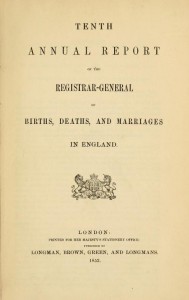
 In autumn 2014, for example, we completed an initial study that used GIS to examine the documentation of cholera epidemics in Victorian England and Wales. This study drew on the annual reports of the General Register Office for England and Wales from 1840 to 1880. To learn more about this study, please click here.
We are currently completing another case study that concentrates on rural areas, including small towns and villages, in order to address the following questions:
- Were the areas on which government and other reports concentrated those with the most severe problems? Were these areas the ones that subsequently showed the biggest improvements?
- To what extent were agricultural change, including national patterns such as the agrarian crisis of the 1890s and other localised changes, linked to changes in mortality?
- Relatedly, did the development of the transport network affect patterns of health and disease?
- Finally, was there a relationship between rural out-migration and health?
In order to answer these questions, we need to integrate a wide range of both quantitative and qualitative sources and to devise the correct methods for analysing them. This will enable us not only to show how using GIS allows researchers to with a range of sources, but also to make an applied contribution to the field of historical demography.
