Thus, a region is a credible region for if
That is, there is a probability of , based on the posterior distribution, that lies in .
Some Bayesians argue that credible intervals have little value since it is the entire posterior distribution which contains the information for inference and that credible intervals have only been proposed in order to give something comparable to confidence intervals.
One difficulty with credible intervals (in common with confidence intervals) is that they are not uniquely defined. Any region with intervals) is that they are not uniquely defined. Any region with probability will do. Since we want the interval to contain only the ‘most plausible’ values of the parameter, it is usual to impose an additional constraint which is that the width of the interval should be as small as possible. This amounts to an interval (or region) of the form
where is chosen to ensure that
These two properties can be described concisely as:
Such regions are called highest posterior density regions. In general, these intervals have to be found numerically
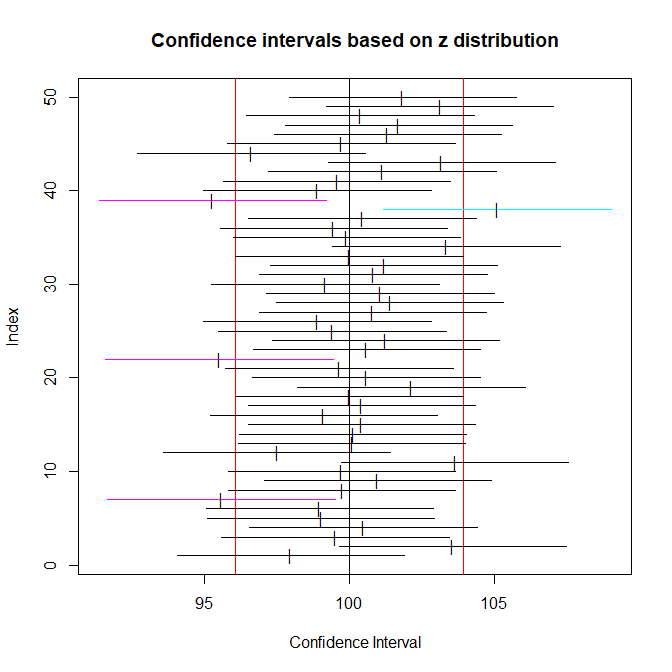
Confidence Interval- Probability that a sequence of intervals (obtained under repeated sampling) includes a parameter (which is assumed fixed but unknown);
Credible Interval - Probability that a variable parameter is included in a fixed interval.
In the first the intervals vary in the second the parameter varies but the interval is fixed.
Practitioners frequently confuse these two types of interval.