Lava flow dynamics
We are using laboratory, field and remote sensing measurements of active lava flows to address questions such as:- Can the role of degassing-driven crystallisation be quantified?
- What are the critical processes in lava tube formation?
- When and where will ephemeral vents form?
- Can we measure changes in important flow properties, such as rheology, in order to improve flow models?
- How do variations in the rate of lava flow affect the evolution of flow fields?
Related publications
See below for time-lapse footage associated with some of this work.
- Slatcher, et al. (2015) Quantifying effusion rates at active volcanoes through integrated time-lapse laser scanning and photography.
- Farquharson, et al. (2015) Examining rhyolite lava flow dynamics through photo-based 3-D reconstructions of the 2011-2012 lava flowfield at Cordón Caulle, Chile.
- James and Robson (2014) Sequential digital elevation models of active lava flows from ground-based stereo time-lapse imagery.
- Lev and James (2014) The influence of cross-sectional channel geometry on rheology and flux estimates for active lava flows.
- Tuffen, et al. (2013) Exceptional mobility of a rhyolitic obsidian flow: observations from Cordón Caulle, Chile, 2011-2013.
- Ganci, et al. (2013) Separating the thermal fingerprints of lava flows and simultaneous lava fountaining using ground-based thermal camera and SEVIRI measurements.
- Hamilton, et al. (2013) Topographic and stochastic influences on pahoehoe lava lobe emplacement.
- James, et al. (2012) Lava channel roofing, overflows, breaches and switching: insights from the 2008-9 eruption of Mt. Etna.
- Applegarth, et al. (2010) Lava flow superposition: the reactivation of flow units in compound flow fields.
- Applegarth, et al. (2010) The influence of surface clinker on the crustal structures and dynamics of 'a'a lava flows.
- James, et al. (2010) Imaging short period variations in lava flux.
- Coppola, et al. (2010) A comparison of field- and satellite-derived thermal flux at Piton de la Fournaise: implications for the calculation of lava discharge rate.
- Applegarth, et al. (2010) Morphological complexities during the emplacement of channel-fed 'a'a lava flow fields: a study of the 2001 lower flow field on Etna.
- James, et al. (2009) Detecting the development of active lava flow fields with a very-long-range terrestrial laser scanner and thermal imagery.
- Smethurst, et al. (2009) A statistical analysis of eruptive activity on Mount Etna, Sicily.
- Harris, et al. (2007) Lava flow cooling, discharge and coverage rates from thermal image chronometry.
- James, et al. (2007) Image-based measurement of flux variation in distal regions of active lava flows.
- James, et al. (2006) Oblique photogrammetry with visible and thermal images of active lava flows.
Recent projects
- 2011-2012 Quantifying degassing-driven crystal growth in basaltic lavas (NERC) With Hugh Tuffen, and Jane Applegarth
- 2007-2012 The effects of degassing and effusion rate fluctuations on the evolution of basaltic lava flow (NERC) With Harry Pinkerton, Hugh Tuffen and Jane Applegarth
Time-lapse footage
Footage taken at Mt. Etna, Sicily, using Canon EOS 300D or 450D cameras, either for short lengths of time while we were in the field, or from remote cameras that operate throughout most of the year. Camera installations were assisted by Harry Pinkerton, Neil Slatcher and Jane Applegarth, under some rather variable weather conditions.... Etna 2011 activity from the new vent on the South East Crater. Image interval 15 mins., duration 12 hrs. Spectacular fountaining, with flows cascading down the headwall of the Valle del Bove.
 Gentle lava effusion at Etna during 2009. Time-lapse taken over 10 days, looking towards the headwall of the Valle del Bove. Fusing these time-lapse data with lidar topography allows flow advance rates to be quantified and rheology estimated (Applegarth et al., 2011; James et al., 2011)
 'A'a flow front (2008) in the Valle del Bove. Image interval 1 min., duration ~2 hrs. People for scale. This is one sequence of a stereo-pair that were used to obtain the 3D evolution of the flow (James & Robson, 2014; Robson & James, 2007).
 Pulses of lava descending steep channels in the headwall of the Valle del Bove during the 2008-9 eruption of Mt. Etna. Images taken with an adapted Stealthcam over a period of a week (James et al. 2010), of which, one night is shown here.
  Thermal time-lapse imagery of advancing 'a'a lava in the Valle del Bove. The flow fronts are fed by lava channels that descend the headwall of the valley (top of the frame). As the clip progresses, a pulse of lava is seen descending the channels and overflowing the levees (James, et al. 2007; 2006).
  An 'a'a lava flow front, approximately 7 m tall, advancing slowly near the end of its life (2004). Image interval 30 sec., duration 20 min..
Combining time-lapse and topography
Ongoing work is based on Mt. Etna, Sicily, where we have been integrating thermal imagery and remote time-lapse camera data with 3D topography in order to quantify flow processes during effusive eruptions. For close-range sequences (e.g. covering the death (or was it? - low-res time-lapse video, or high-res version from here) of a bocca) topography can be derived using computer vision 'structure-from-motion' (SfM) techniques.
Time-lapse, topography and flow velocities
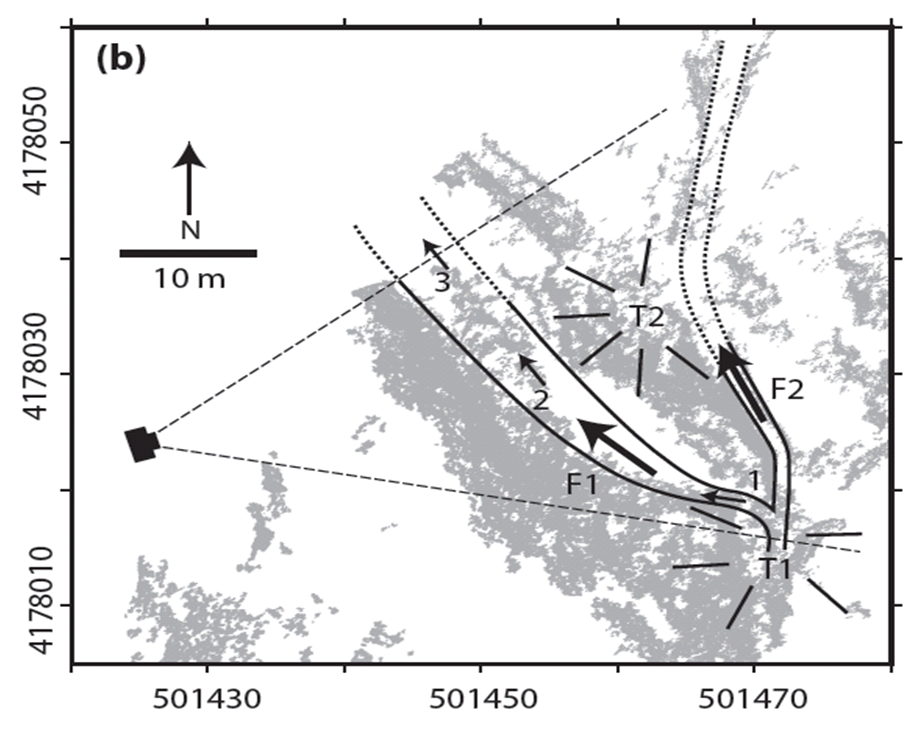
Left: Map of an active area of Etna's lava flow field (2009), with two active flow channels (F1, F2) erupting from tumulus T1. Dashed lines indicate field of view of time-lapse camera from which image below was taken.
Below: Extract of one of the time-lapse images overlain with a colour-coded pixel displacement map highlighting lava flow in the F1 channel. Combining the imaging geometry with topogaphic data allows the pixel displacements to be converted into 'real' velocity vectors. See time-lapse and topography fly-through here.

From James et al. (2012). Lava channel roofing, overflows, breaches and switching: insights from the 2008-2009 eruption of Mt. Etna, DOI: 10.1007/s00445-011-0513-9
Lidar and time-lapse sequences
For long-range imagery (i.e over several kilometres) terrestrial or aerial LiDAR can be used to provide topographic data. Combining topography and imagery is carried out using photogrammetric principles implemented in MATLAB. Such work has enabled improved comparison between ground based thermal imagery and satellite data through rectification of thermal mosaics. Photogrammetric approaches and 'optical flow' based image measurements have also been able to estimate lava rheological parameters and quantify flow variability.
Thermal imagery, time-lapse and lava rheology


Left: Thermal image data draped over very-long-range TLS topograpy acquired with a Riegl LPM-321 during the Etna 2009 eruption. Topographic change indicates the areas of flow field growth between surveys, the thermal data indicate the currently active channels. From James et al. (2009) DOI: 10.1029/2009GL040701, see also Coppola et al. (2010). DOI 10.1007/s00445-009-0320-8
Right: Combining photogrammetry and optical flow to determine lava rheology. Channel topography (cross sections in left panel) was ascertained using ground-based photogrammetry when the channel was nearly drained. When full, thermal time-lapse imagery allowed optical flow to be used to determine surface velocities. Combining the two allowed different rheological models to be assessed. From James et al. (2007). DOI: 10.1029/2006GC001448