
Rebecca Furnell

Image settings
I am a Data Analyst Apprentice working for Vodafone, a global telecommunications company. My team is called the Business Insights Team, and our core value is in the provision of key business insights and enabling data-driven discussions.
As part of my role, I work with the business to develop, collect data, and report on Key Performance Indicators (KPIs). The data collection of these KPIs was created tactically, without consideration for the integrity of captured data. The data collection process required a security upgrade; however, I was also interested to know how a process change might affect the user experience.

Image settings
Data Management
Strengholt (2021) explains how Data Management disciplines are vital to organisations, so that they can stay in control of their data. The research suggests that out of control data becomes ineffective, therefore lacking the insight a business needs to make data-driven decisions. Whilst there are many areas of Data Management, two were considered relevant to this data collection process; Data Governance and Security, and Data Quality.
Data Collection Tools and Security
The current data collection process is manually completed on Microsoft Excel. Microsoft (2023) describes how an Excel workbook can be protected; by using encryption and access restriction, in addition to worksheet protection with locked cells and passwords, a workbook can be much more secure.
Workplace Change
Some changes in the workplace can cause individuals to experience stress (Bickford, 2005). Bickford explains that experiencing stress in the workplace can affect the body both physically, psychosocially, and behaviourally. The research deduces that upskilling employees, facilitating open discussion for feedback, and providing social support, may minimise the likelihood of workplace stress.
Conclusion
Continuing to use Excel could minimise the risk of impacting the employee, because there will be no major change to the type of software. Additionally, Excel has security features that can be implemented that will improve the integrity of the data.

Image settings
Sampling
Requested volunteers from the Vodafone population to participate in the experiment. Volunteers remained anonymous through the experiment, but some demographic data was collected.
Out of 17 volunteers, 15 participants completed the study. Majority of the participants had achieved an undergraduate qualification, or higher, and had been in the business for more than 1 year.
Procedure
A new data collection tool was developed, which had the addition of password protection, and locked cells. Participants were randomly assigned either the original data collection tool, or the improved one. They were tasked with entering data in to the tool, and then a survey followed.
Survey
The survey was created using Microsoft forms, which is Vodafone's has a preferred tool. Participants responded to questions that requested quantitative and qualitative responses regarding their experience using their allocated tool.
The study is ongoing, however preliminary results can be deduced from early analysis.

Image settings

Fig 1 of 3 - Data Collection Tool 1

Fig 2 of 3 - Data Collection Tool 2 - Data Entry

Fig 3 of 3 - Data Collection Tool 2 - Data View
Image carousel settings
Data Collection Tool 2 had a view of the data (Fig 3) that is similar to the view of the original tool. This is an attempt to provide a familiar view of the data to the user.
An initial analysis of data has been completed.
Participants were asked to provide 3 words that described the feelings they experienced when using their assigned tool. They were provided with an emotion wheel to help them with relevant words.
The data gathered from participants' survey responses was then categorised, as per the wheel.
WB1 is the original Data Collection Tool. 24 words were provided by participants, 16.7% of which were excluded because they were not feeling words.
WB2 is the security upgrade Data Collection Tool. 14 words were provided by participants, 29% of which were excluded because they were not feeling words.
Both datasets have 10% of the words being categorised as 'Fearful'. The remainder of the words provided by WB1 participants were categorised as 'Happy' (90%), whilst the percentage of 'Happy' words used by WB2 participants was lower (70%). WB2 participants provided some Bad words; these were 'Bored' and 'Indifferent'.
These results suggest that there may be an impact on the experience of participants that used WB2; however, further analysis on results is required.
References: 1) Bickford, M. (2005) Workplace Stress 1 Stress in the Workplace: a General Overview of the Causes, the Effects, and the Solutions. Available at: https://myfreedom2017.com/wp-content/uploads/2017/04/Work-Place-Stress.pdf [Accessed: 28 February 2023]. 2) Microsoft (2023) Protection and Security in Excel. Available at: https://support.microsoft.com/en-us/office/protection-and-security-in-excel-be0b34db-8cb6-44dd-a673-0b3e3475ac2d [Accessed: 4 February 2023]. 3) Rajagopal & Behl, R. (2016) Business Analytics and Cyber Security Management in Organizations. [Online]. Hershey: Business Science Reference. Available at: https://www.google.co.uk/books/edition/Business_Analytics_and_Cyber_Security_Ma/MiaRDQAAQBAJ?hl=en&gbpv=1 [Accessed: 28 February 2023]. 4) Strengholt, P. (2021) Data Management at Scale: Best Practices for Enterprise architecture. 1st ed. [Online]. California: O’reilly Media. Available at: https://www.google.co.uk/books/edition/Data_Management_at_Scale/GunzDwAAQBAJ?hl=en&gbpv=1&dq=Data+Management&printsec=frontcover [Accessed: 24 November 2022].

Fig 4 - WB1 Feelings Analysis
Image carousel settings

Fig 5 - WB2 Feelings Analysis
Image carousel settings
Further Analysis
The data from participants will include feedback on many areas of the Data Collection Tools, and their experience while using it. This data will be analysed to provide insight to the user experience.
There will be an analysis of the completed tools submitted by participants to check for errors.
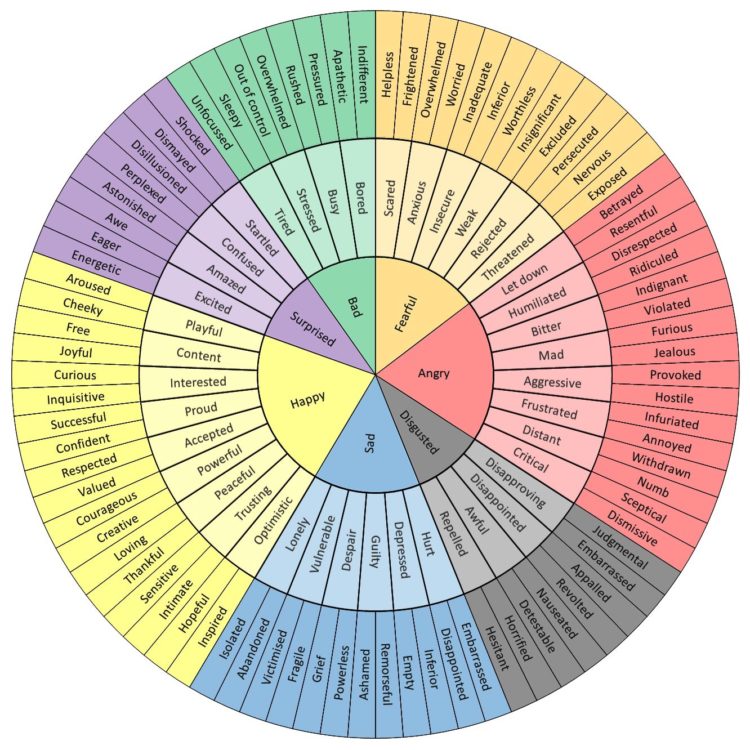
Image settings
Fig 6 - Emotion Wheel