
Hidde Ploeger
Background:
Melanoma, cancer of the melanocytes (the pigment producing cells of the skin), is the most common skin cancer and its prevalence is increasing rapidly in recent years especially in developed, fair-skinned nations such as the UK. The need for novel treatments and improvements in understanding is an ever-present issue.
Glis1-3 as novel regulators:
The set of 3 Gli-similar (Glis) genes are a set of transcription factors that have been implicated in variety of diseases, and have also been associated with melanoma, though the mechanism by which they do so is still poorly understood (Lichti-Kaiser et al., 2012). Glis genes have also been associated with the primary cilium, a hairlike structure associated with development but also linked to melanoma (Zingg et al., 2018). As the embryonic precursors of melanocytes, melanoblasts, are extremely invasive and proliferative similar to the undifferentiated melanoma cells, Glis could be the link that controls this phenotype switching (from invasive/proliferative to stationary/non-replicating back to invasive/proliferative) and as such controls both melanoma progression and melanocyte development. (See figure below)
Methods:
Knockdowns of Glis1-3 were prepared using short hairpin RNA (shRNA) and transfected with a biosensor for the primary cilium and the cell cycle to determine a quantitative effect of Glis on the cilia and by proxy melanocyte development. They were imaged and analysed in ImageJ.
A set of the Glis1-3 regulated genes was identified via Swiss Regulon and a literature search and they were ordered based on their expression in melanoblasts with any unexpressed genes being excluded from further analysis. The gene list was analysed for overrepresentation in Reactome, a tool for comparing a list of genes to pathways and identifying if the input genes are overrepresented in any pathways. This might indicate pathways regulated by Glis and specific genes which might be transcriptionally active in melanocyte development or melanoma. These genes would lend themselves well as novel treatment targets. The identified pathway was then analysed in survival studies via OncoLnc (http://www.oncolnc.org/) and by PCR with gel electrophoresis.
Results:
Imagining results indicated that Glis genes seem to affect not only the number of cilia and their length, but also affected the proportion of cells that were in the cell cycle, this was obtained from measuring the cells as seen in the example figure below with red cells representing those in G1 and green those in G2/S/M, and the cyan colour lines demonstrating the cilia.
Future Considerations:
While these results seem to indicate a set of interesting genes and corroborate the findings that Glis genes modulate the primary cilium and development, the future aim would be to establish their effects on melanoma progression apart from the apparent effect on survival by Nfe2l2 and Pip4k2c. qPCR to measure the level of expression across multiple cDNAs would be the next step to determine if expression levels change across differentiation i.e. melanoblast cDNA, melanocyte cDNA, and melanoma cDNA.
Furthermore, Glis1-3 shRNA knockdown cDNAs would be useful in determining the specific effects of the Glis genes on the target genes and comparing it to the control in scrambled shRNA cDNA. The ultimate goal would be to determine the genes or TFs that mediate phenotype switching as they would be excellent targets for therapies. Lastly, the identification of novel biomarkers that can aid in detecting and monitoring melanoma especially its metastatic form are also incredibly useful, and Nfe2l2 and Pip4k2c may contribute to this goal.
Conclusions:
Glis genes seem to affect both cilia formation and length. The primary cilium is a vital developmental structure that helps cells differentiate and progress through the cell cycle especially through the sonic Hedgehog and Wnt signalling pathways (Choudhury et al., 2020). Furthermore, the knockdown of Glis2 resulted in an increase in the number of cells in G2/S/M relative to G1 which could indicated a shortening of the G1 phase and that Glis2 is responsible for timing the G1 exit.
The pathway analysis produced a set of 6 genes involved in TP53 gene (p53 protein) regulation and were significantly overrepresented within this pathway. Further analysis indicated that the level of expression of 2 of these genes significantly affected the survival of SKCM patients but with opposite mechanisms. This suggests that these genes may modulated or are modulated by the factors affecting the tumour suppressor gene, p53, though the nature of this relationship is still unknown.
The Glis genes and target genes were all expressed in melanoblasts which suggests that they might be implicated in the development of melanocytes.

Image settings
Credit: Cancer Research UK.


Image carousel settings
Figure 1: Glis1-3 input into the Graeber lab resource (https://systems.crump.ucla.edu/dediff/) for visualising differentiation status in melanoma demonstrating how the undifferentiated cell lines displaying the highest expression of Glis genes undifferentiated/neural-crest-like (Tsoi et al., 2018)
References:
CHOUDHURY, A., NEUMANN, N. M., RALEIGH, D. R. & LANG, U. E. 2020. Clinical Implications of Primary Cilia in Skin Cancer. Dermatol Ther (Heidelb), 10, 233-248.
LICHTI-KAISER, K., ZERUTH, G., KANG, H. S., VASANTH, S. & JETTEN, A. M. 2012. Gli-similar proteins: their mechanisms of action, physiological functions, and roles in disease. Vitam Horm, 88, 141-71.
ORLIC-MILACIC, M. 2015. Regulation of TP53 Activity. Reactome, 55.
TSOI, J., ROBERT, L., PARAISO, K., GALVAN, C., SHEU, K. M., LAY, J., WONG, D. J. L., ATEFI, M., SHIRAZI, R., WANG, X., BRAAS, D., GRASSO, C. S., PALASKAS, N., RIBAS, A. & GRAEBER, T. G. 2018. Multi-stage Differentiation Defines Melanoma Subtypes with Differential Vulnerability to Drug-Induced Iron-Dependent Oxidative Stress. Cancer Cell, 33, 890-904.e5.
ZINGG, D., DEBBACHE, J., PEÑA-HERNÁNDEZ, R., ANTUNES, A. T., SCHAEFER, S. M., CHENG, P. F., ZIMMERLI, D., HAEUSEL, J., CALÇADA, R. R., TUNCER, E., ZHANG, Y., BOSSART, R., WONG, K.-K., BASLER, K., DUMMER, R., SANTORO, R., LEVESQUE, M. P. & SOMMER, L. 2018. EZH2-Mediated Primary Cilium Deconstruction Drives Metastatic Melanoma Formation. Cancer Cell, 34, 69-84.e14.

Image settings

Image settings

Image settings
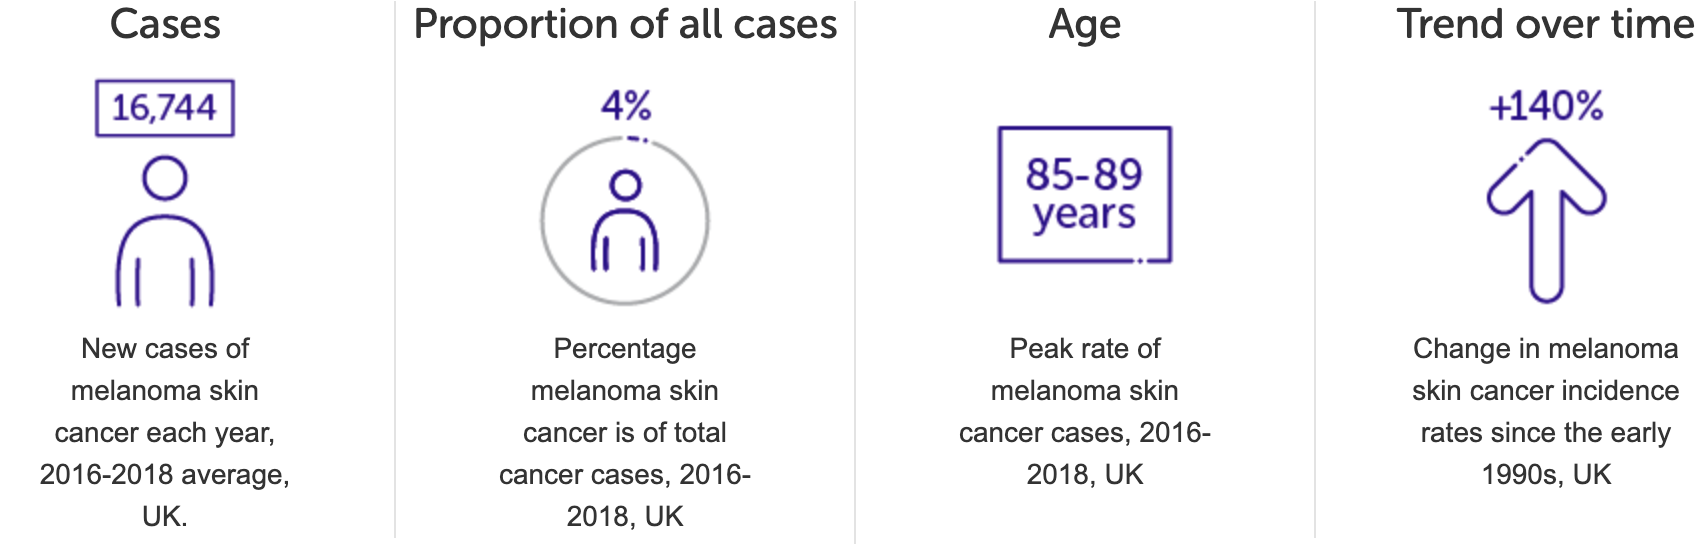
Image settings
Credit: Cancer Research UK.
Acknowledgements:
Special thanks to Dr. Richard Mort for his supervision and support throughout this project.
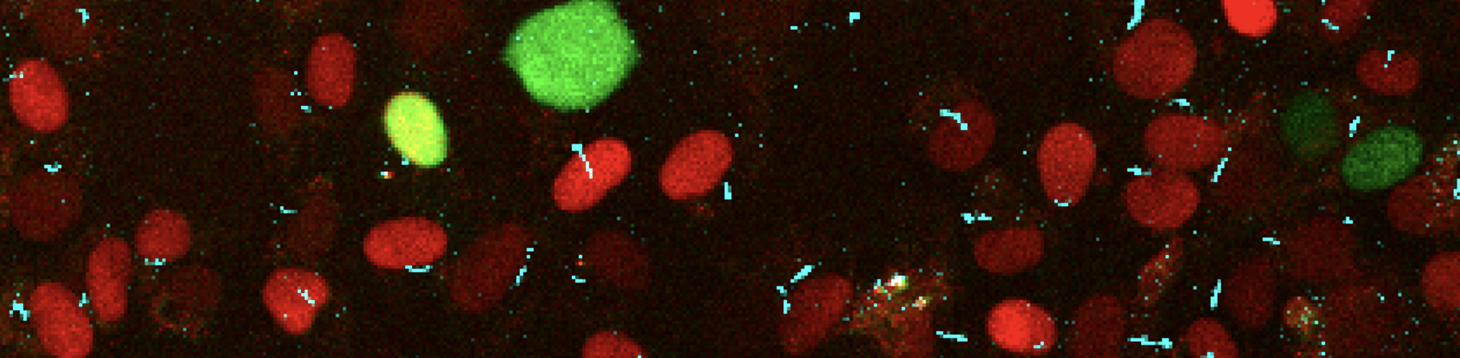
Image settings
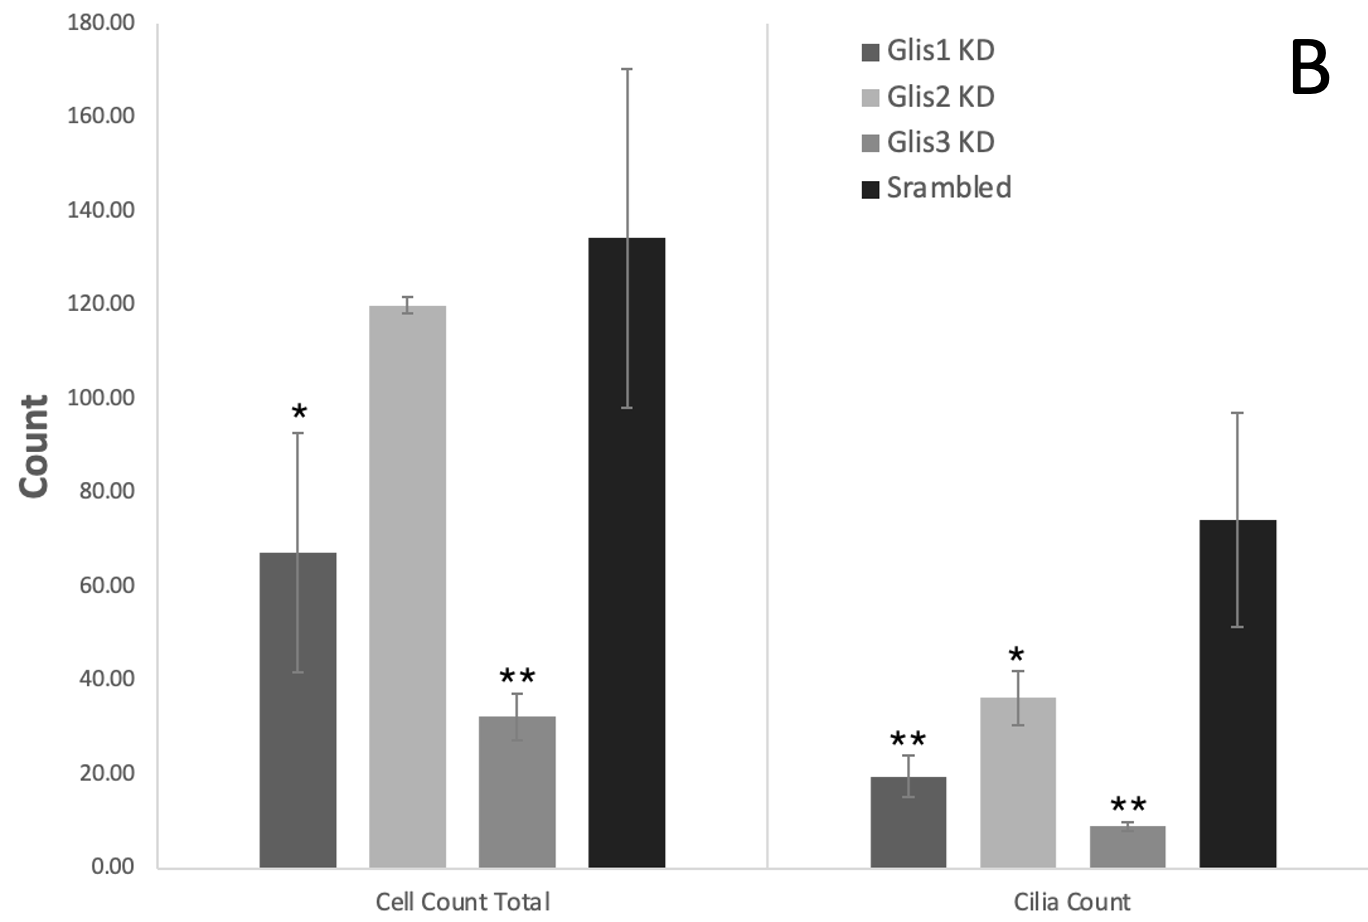
Image settings
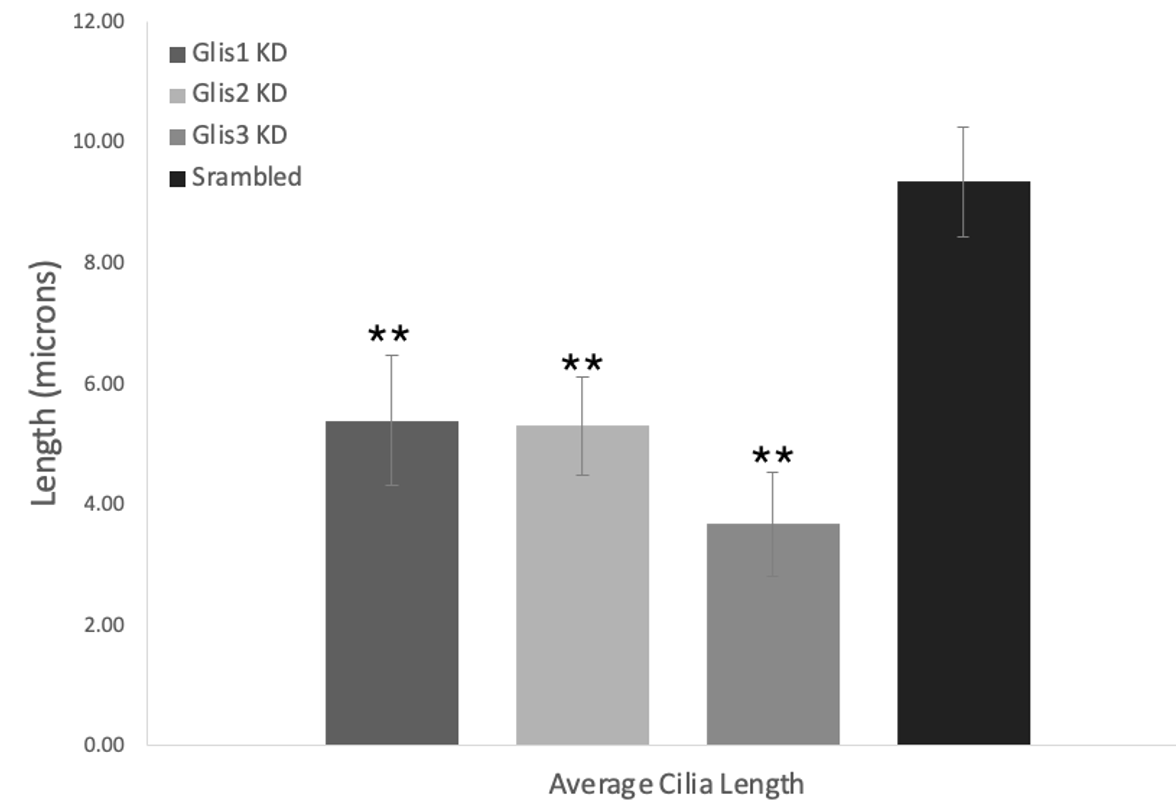
Image settings
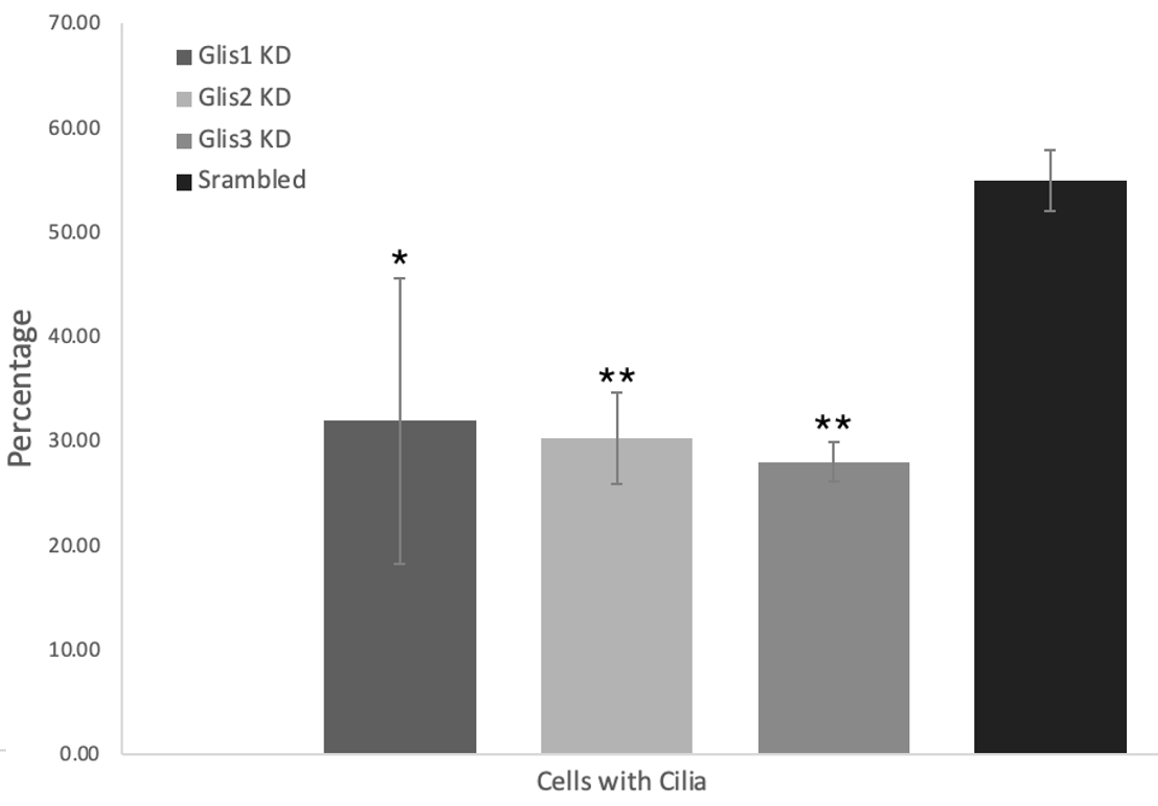
Image settings
Figures 2-4: Knockdown of Glis1-3 results in a significant decrease in the cell/cilia count, average cilia length, and percentage of cells with cilia relative to the scrambled control. The Glis/Scrambled shRNA 3T3 Arl13bCerulean-Fucci2a image sets were analysed in Fiji ImageJ with the cyan cilia being identified and their length measured using a macro. All three Glis shRNA KD displayed a significant decrease in this metric, close to halving, and Glis3 KD displayed the most drastic decrease (* = p<0.05, ** = p<0.01, as verified by one-way ANOVA (p=0.0017, 0.0004, 0.0069) and post-hoc Tukey test)
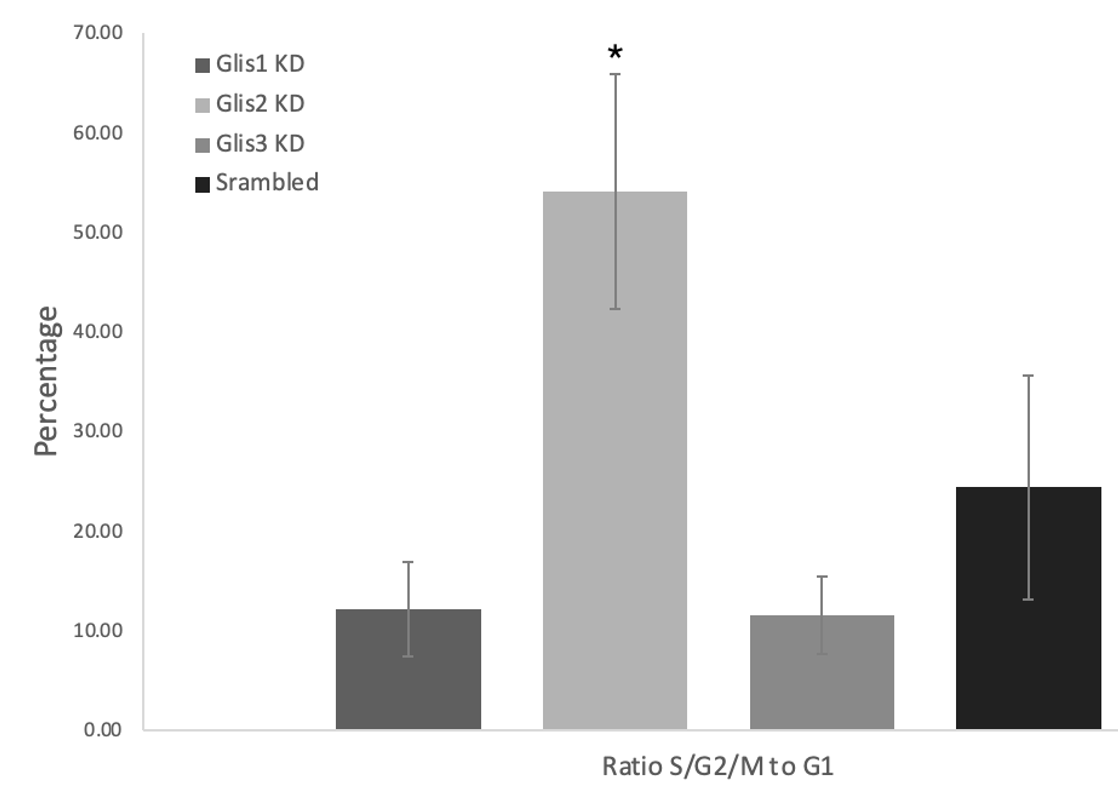
Image settings
Figure 5: Knockdown of Glis2 results in a significant difference in the ratio of cells in S/G2/M phase compared to those in G1 relative to the scrambled control suggesting Glis2 may preferentially impact cell cycle control. The Glis/Scrambled shRNA 3T3 Arl13bCerulean-Fucci2a image sets were analysed in Fiji ImageJ with green-G2/M/S cells and red-G1 cells being counted with the multipoint tool and their ratio calculated into a percentage. Glis2 shRNA KD displayed a significant increase in this metric, more than doubling, and Glis1 and Glis3 KD displaying non-significant decreases (* = p<0.05 as verified by one-way ANOVA (p= 0.0010) and post-hoc Tukey test)
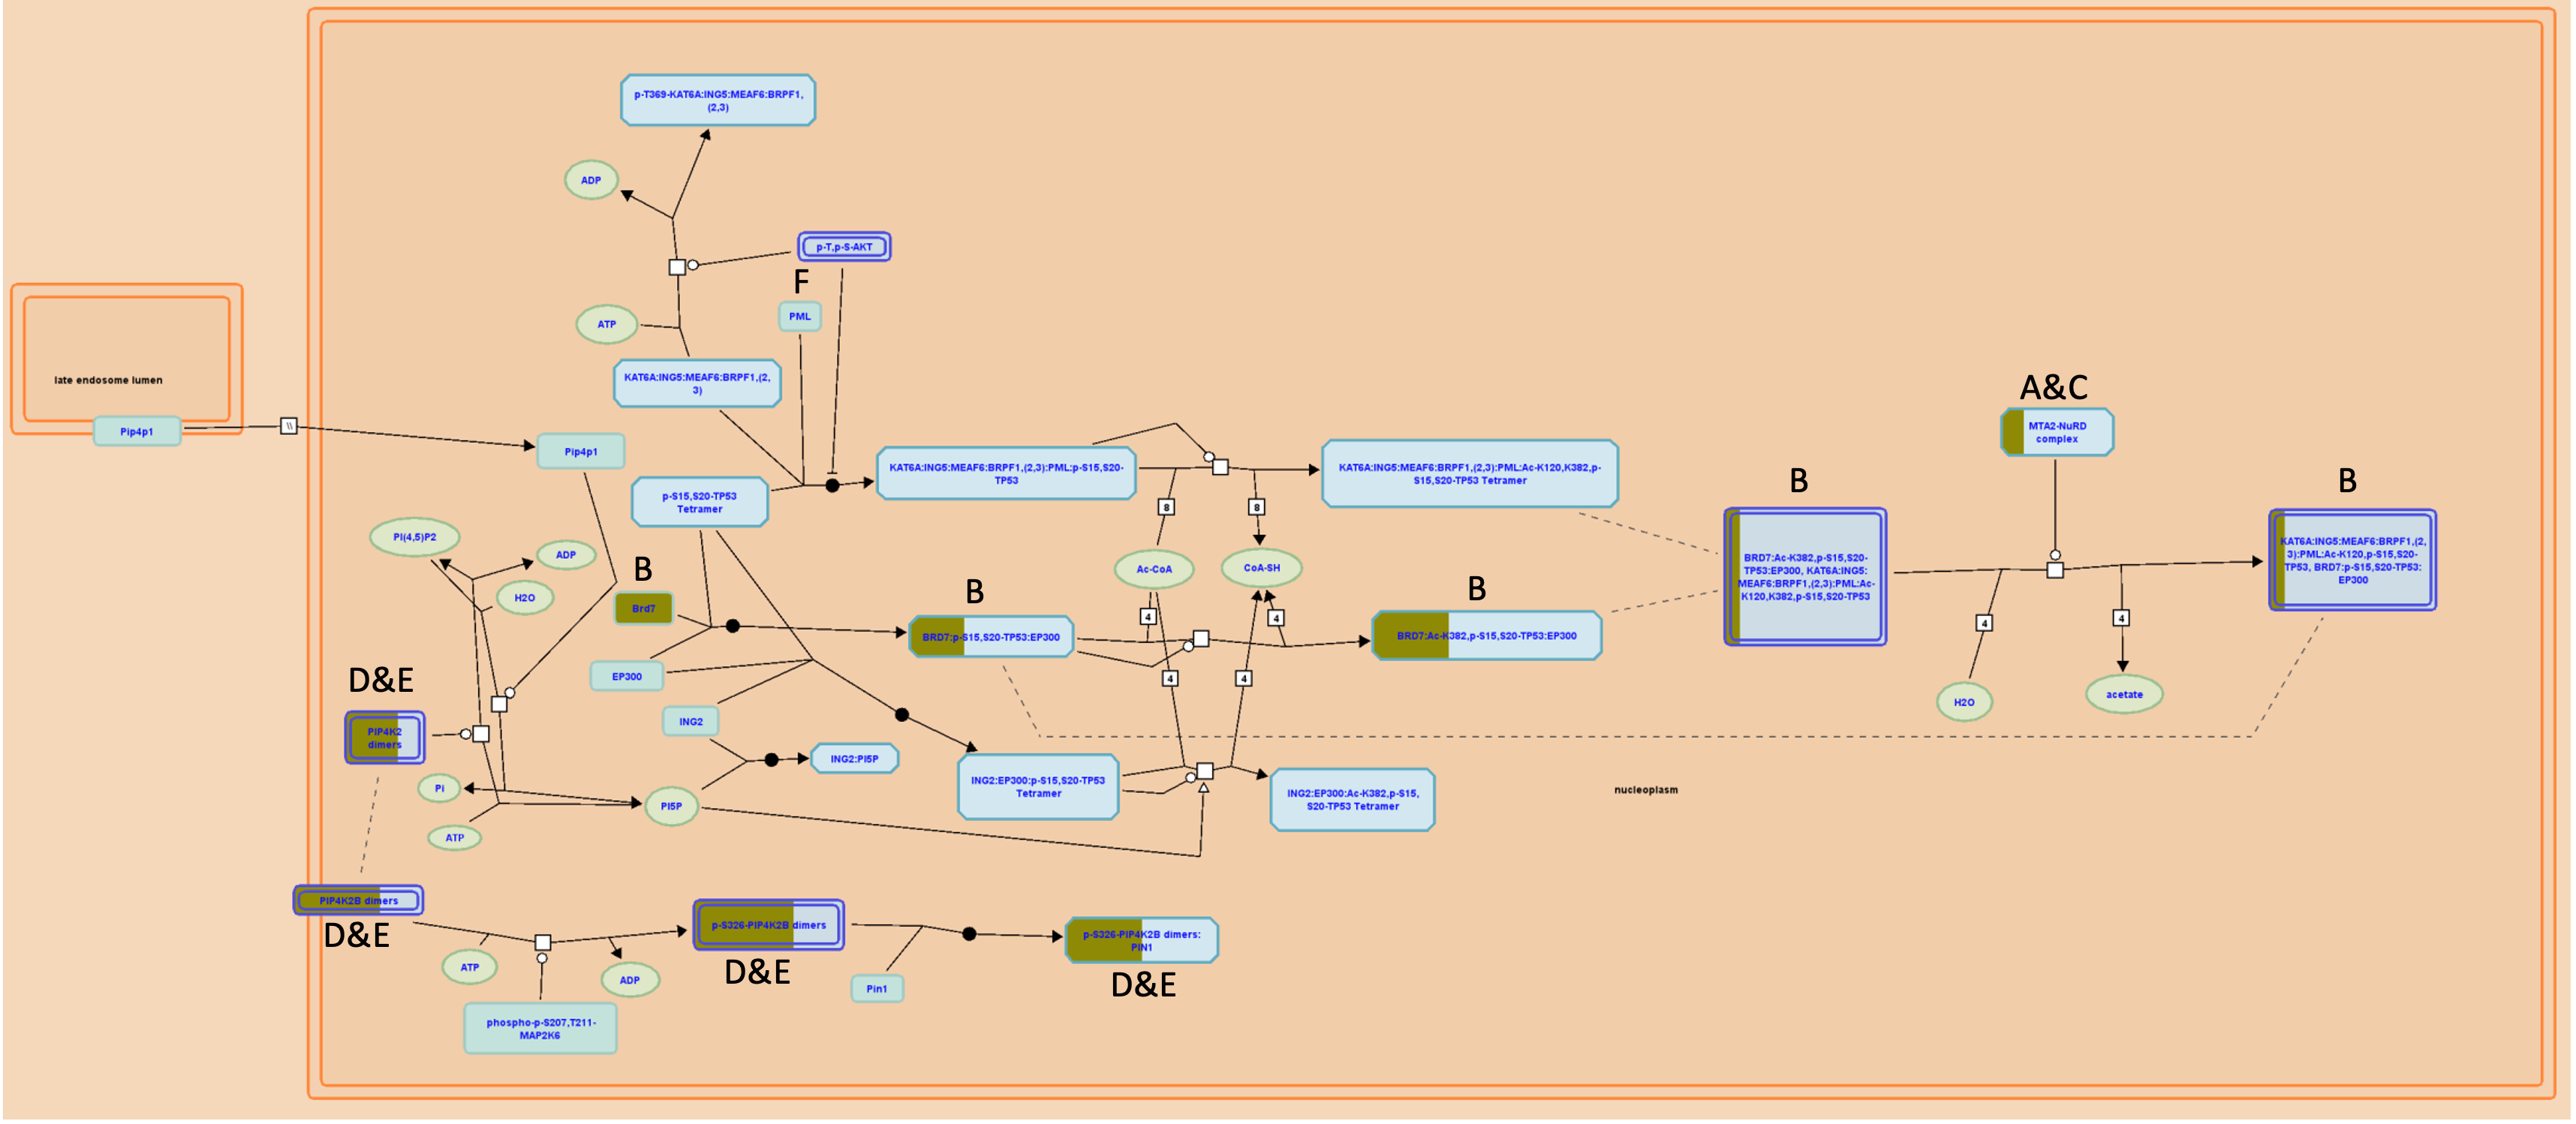
Image settings
Figure 6: Diagram representing the Regulation of TP53 Activity through Acetylation highlighting the locations of target genes. The master list of 502 Glis-associated melanoblast-expressed genes were input into the Mus musculus pathway database of Reactome and the output was filtered for a high level of overrepresentation and relatively low gene count of 3-7. Overrepresentation is demonstrated by yellow colouration, the size of the yellow is relative to the percentage of that stage of the pathway which is also represented in the master gene list of Glis-associated genes, with two linear paths following Brd7 and Pip4k2 dimers emerging. (A) Hdac2, (B) Brd7, (C) Mta2, (D) Pip4k2a, (E) Pip4k2c, (F) Nfe2l2 (Orlic-Milacic, 2015).
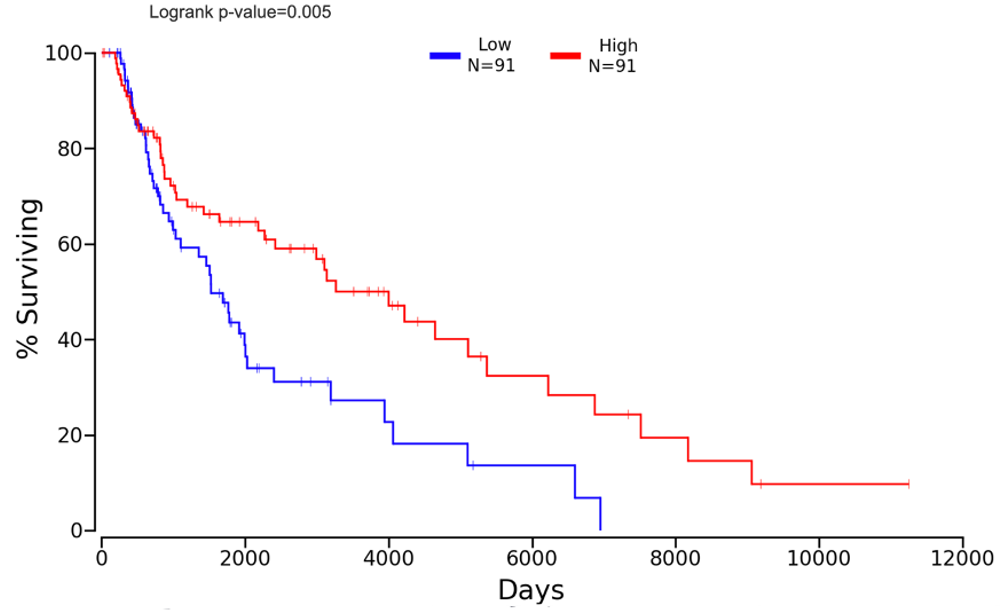
Image settings
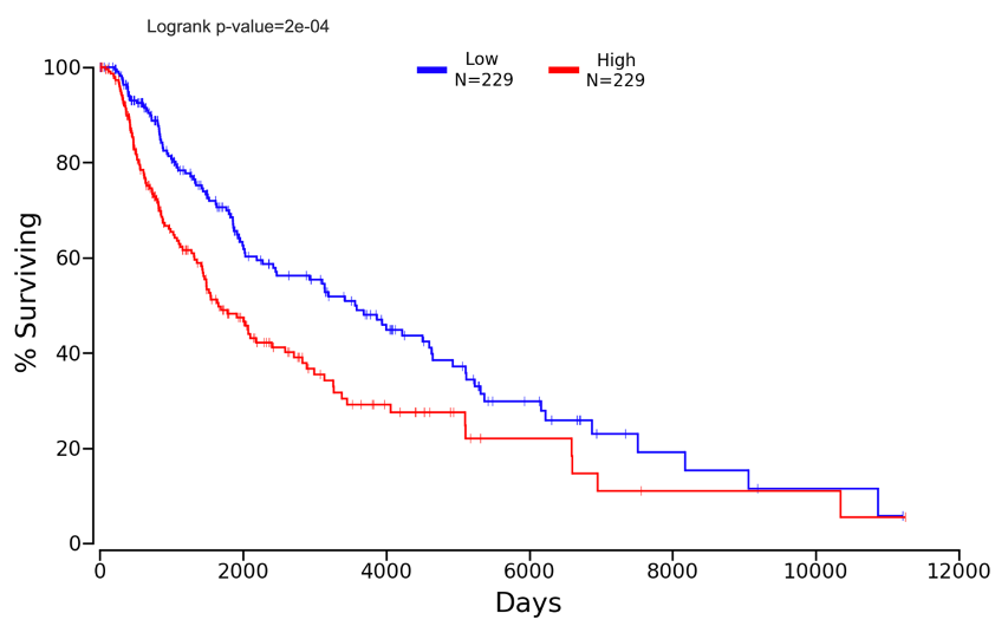
Image settings
Nfe2l2
Pip4k2c
Figure 7: Lower expression of Nfe2l2 is consistent with lower survival in Skin Cutaneous Melanoma (SKCM) patients as demonstrated by Kaplan plot. Nfe2l2 was entered into the OncoLnc tool for linking TCGA survival to mRNA expression and SKCM was selected, the percentiles were adjusted until the highest significance was found with a relatively high number of participants (>50). The comparison in percent surviving between the upper 20th percentile and lower 20th percentile (n=91 each) expression levels of Nfe2l2 in SKCM patients showing the most significant difference in percent survival over time (p<0.01).
Figure 8: Higher expression of Pip4k2c is consistent with lower survival in SKCM patients as demonstrated by Kaplan plot. Pip4k2c was entered into the OncoLnc tool for linking TCGA survival to mRNA expression and SKCM was selected, the percentiles were adjusted until the highest significance was found with a relatively high number of participants (>50). The comparison in percent surviving between the upper 50th percentile and lower 50th percentile (n=229 each) expression levels of Nfe2l2 in SKCM patients showing the most significant difference in percent survival over time (p<0.001).
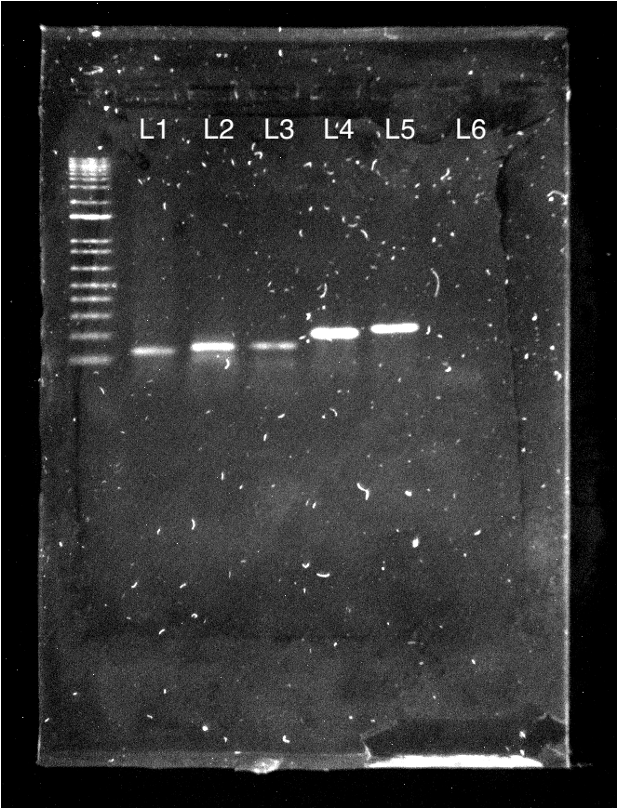
Image settings
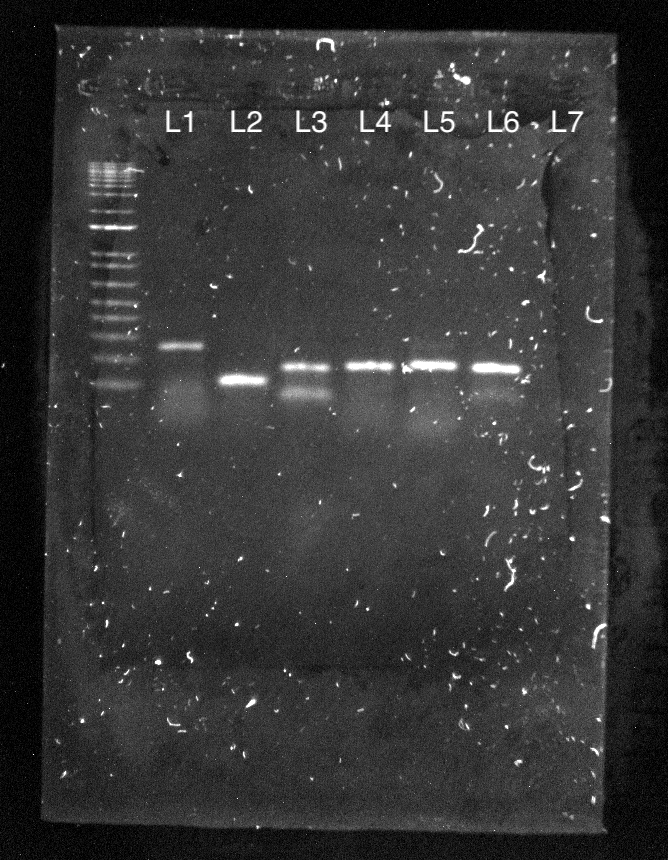
Image settings
Figure 9: Glis1-3 and housekeeping genes are expressed in melanoblast cDNA and present with correct band sizes (Left). Target genes are expressed in melanoblast cDNA and present with correct band sizes (Right). Image taken in Bio-Rad Chemidoc™ of agarose gel containing PCR products using 0.5 μl of each forward and reverse primer for Glis1-3, housekeeping genes, and target genes loaded in 1% agarose-TBE gel as such: L1-Glis1, L2-Glis2, L3-Glis3, L4-Actin, L5-GAPDH, L6-Water (Left) L1-Hdac2, L2-Brd7, L3-Mta2, L4-Pip4k2a, L5-Pip4k2a, L6-Nfe2l2, L7-Water (Right). Products, when compared to the 1 kb ladder with the shortest band being 100 bp, match the primer lengths.