
Censored demand
Censored demand happens when a shop — or any other type of retailer — runs out of stock. How do they know how much more they could have sold? Having a good handle on this is important for retailers, particularly those that stock perishable goods. This post will explore ways in which mathematical models can help them to do that.
As part of our assessments here at STOR-i we have to write a short report on a research topic of our choice (as well as a long one, which I’m working on now). For my short report I wrote about retail analytics, and particularly the issue of censored demand. You can see the link to the report at the bottom of this post.
Forecasting demand for retailers is a thorny problem. They need to estimate how much they are going to sell to decide how much stock to order.
But, unless they have very high levels of stock, they are probably going to have days when they sell out. So then how do they decide how much demand is actually out there?
This is a particularly big problem for those that stock perishable goods. If a retailer were to order in a mountain-sized pile of grapes, for example, they would have to throw away what they didn’t sell after just a few days.
Waste is something retailers need to avoid — not just for their profits, but there are global environmental reasons why we should all be trying to cut down on waste.
On the other hand, if a retailer regularly runs out of stock, they could find that customers decide to shop elsewhere.
Mathematical models can help us to overcome some of this uncertainty.
In my report I focused on parametric models. This means we assume that the demand conforms — in gross — to an underlying mathematical distribution.
This is helpful, because if we can observe a bit of the distribution, we can gain insight into what the bits we cannot see might be like.
More formally, we can use the observed demand (the demand recorded before the retailer ran out of stock) to make inference about the unobserved demand (the demand that the retailer didn’t fulfil after they ran out of stock).
I look closely at two methods in my report: one to deal with normally distributed data (Nahmias’ method) [1], and one to deal with demand that corresponds to a Poisson distribution (Conrad’s method) [2].
In my report I show that these methods work nicely, as long as we have picked the right distribution.
But not all retail demand behaves nicely and conforms to the distribution we assume (or sometimes any distribution at all).
What can go wrong?
What follows is an illustration of what can happen if we use a good method but we assume the wrong underlying distribution.
In the picture below (nabbed from my report), I’ve simulated data from a bimodal distribution.
In this case it is data from two normal distributions, with different means and variances. In the picture, I’ve plotted a histogram of the simulated data.
I create a right-censored data set by removing any data points with a value higher than 120. The removed data is represented by the dark blue columns.
I then look at what happens if I assume (mistakenly) that my data is normally distributed. So I then use Nahmias’ method to estimate the distribution based on the only data I can now use (the light blue columns).
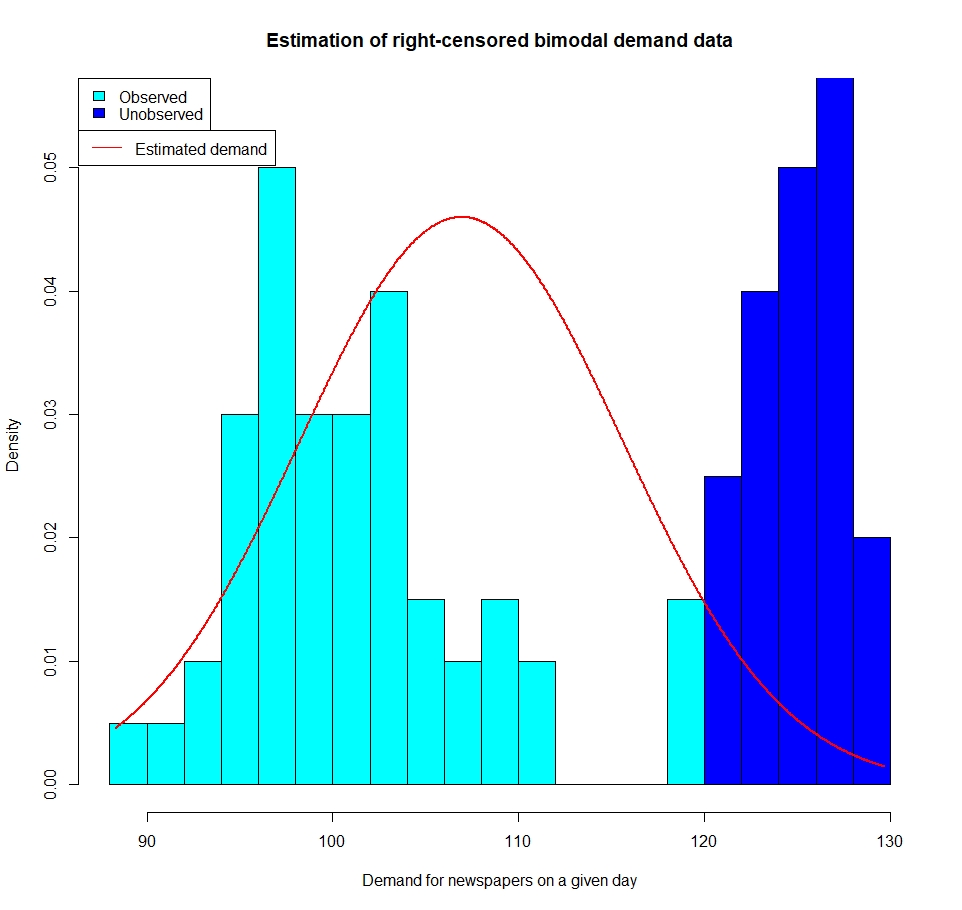
And so I’ve got things very wrong. The red line represents what I think the true demand looks like. You can see I totally miss the second (unobserved) peak.
Nahmias’s method is really good on censored data that comes from a normal distribution but I’m deliberately tripping it up by giving it a nasty (but plausible) underlying distribution.
This is a simulation, so I known I’m getting it wrong. Bear in mind that if this was a real world situation I would only be able to see the light blue columns. Based on that, assuming normally distributed data maybe isn’t great, but it would not be completely silly either.
If you want to read more about this subject, below are some links to papers I mention in this post (as well as my report).
[1] Nahmias, S. (1994). Demand estimation in lost sales inventory systems. Naval Research Logistics (NRL), 41(6):739–757.
[2] Conrad, S. (1976). Sales data and the estimation of demand. Journal of the Operational Research Society, 27(1):123–127.


You May Also Like
One Comment
Pingback: