Every so often at STOR-i there are talks on sophisticated data analysis techniques, during which I’ve heard the word “spline” thrown around quite a lot. As someone who wasn’t aware of what they were, I’ve read around a bit and I’d like to offer some insight and possibly clear some misconceptions about them.
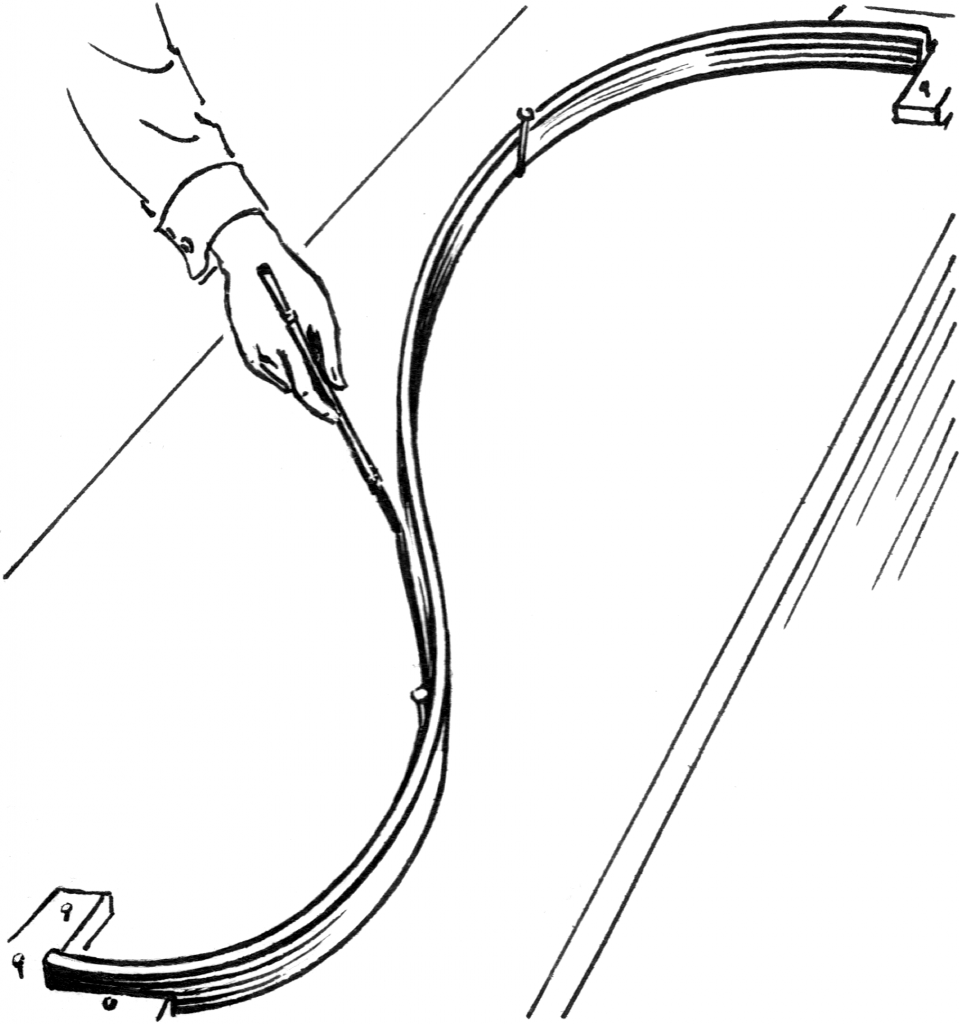
First, a historical note. Splines, originally a shipbuilding term, were long strips of wood bent into smooth shapes by holding them fixed at certain points, usually by lead weights called “ducks”.
In mathematics, we build on this idea to call a smooth piecewise polynomial a spline, which is generally used to approximate some unknown curve. Each piece of a spline is specified in between two “knots” (analogous to the ducks), where the spline is forced to be as smooth as possible, roughly speaking.
The traditional use of splines is for interpolation (fitting a curve that goes through some points exactly), in which case we choose the knots to tell us where the spline must pass through, not unlike the nails in the above drawing. While a single polynomial of high enough degree could pass through a finite set of points just fine, it would exhibit Runge’s phenomenon, oscillating wildly at the boundary of its domain. This is unrealistic, and we can tactfully avoid it by using lower degree splines.
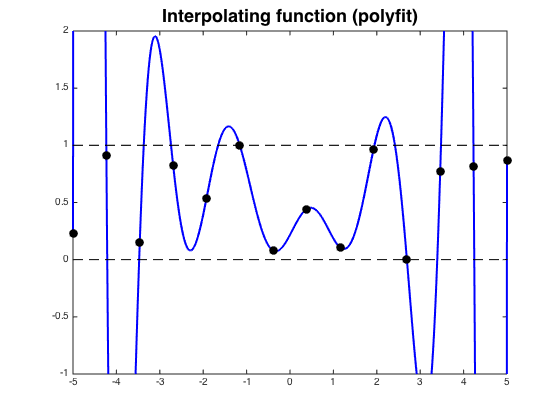
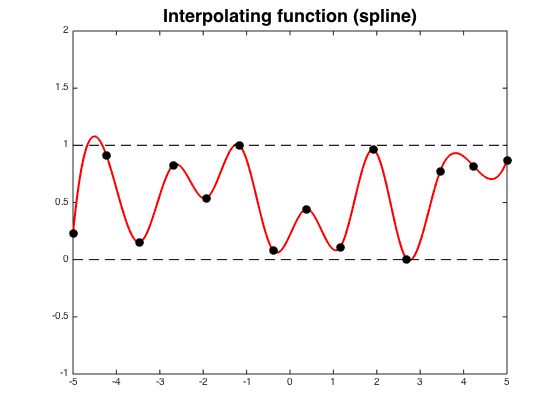
Runge’s phenomenon in action, on the left. Cubic spline interpolation on the right. Images courtesy of “lhf” on StackExchange.
Statisticians use splines in a different context. When we are trying to estimate a function, such as the trend of power usage against the time of day in the UK, it will often both be very non-linear and quite smooth. It is then reasonable to assume a spline would approximate it well. A spline estimate can be computed relatively straightforwardly by using the decomposition property (writing it as a linear combination of basis splines).
As for interpolation, we need to specify the knots. Here it is crucial to stress that we do not want our spline to pass through the data points! Otherwise, the spline would exhibit a severe case “overfitting”, with our estimate being completely enslaved to measurement error while missing the overall trend.
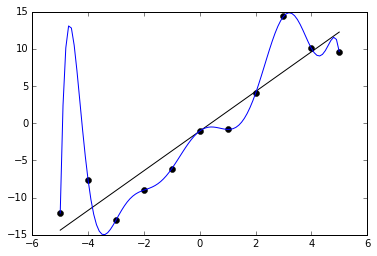
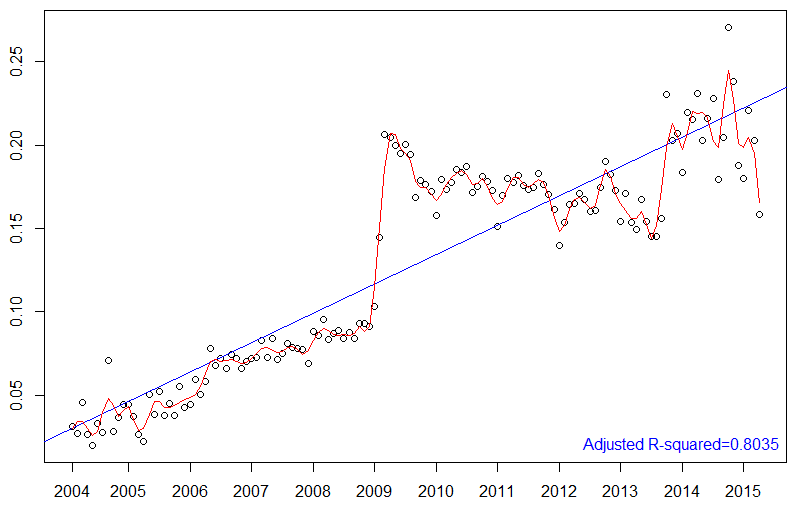
Overfitting with a polynomial of degree ten, where the real trend is linear. Credit to “Ghiles” on Wikipedia Commons.
The knots should therefore be chosen carefully and/or independently (e.g. at equally spaced points), and have little interpretation beyond providing a rough idea of the flexibility of our spline. Keeping this basic principle in mind, splines are a useful tool for understanding nonlinear relationships within data.