Spoiler: yes. But read the rest of this post to find out why we’re reasonably convinced.
The expert opinion on back pain is that it falls into three categories:
- Nociceptive: Pain that arises from actual or threatened damage to non-neural tissue, occurring with a normally functioning somatosensory nervous system.
- Peripheral neuropathic: Pain initiated or caused by a primary lesion or dysfunction in the peripheral nervous system.
- Central sensitization: Pain initiated or caused by a primary lesion or dysfunction in the central nervous system.
Fop, Smart and Murphy (2017) challenge the established point of view and ask whether data on patients with back pain can offer new insights on this classification. They want to determine what categories arise naturally from data, whether they overlap with the existing classification, and whether some of the indicators used to diagnose back bain are redundant or non-informative.
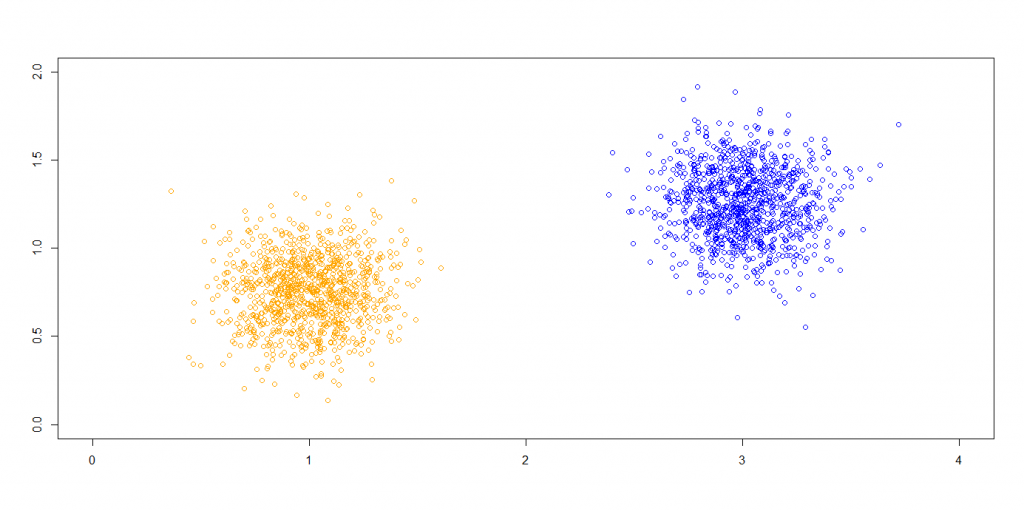
Before I dig into the findings of the paper, a foreword on clustering. The task of dividing a set of observations into meaningful groups, without knowing anything about the groups before analysing the data, is called “clustering”. Intuitively, observations in each group should be similar to each other and observations in different groups be markedly different. So if you have observations that look like this,

then reasonably there should be two groups, with the blue points falling in one group and the orange ones in another. You’re actually answering two questions when clustering: how many different groups there are and what observations lie in each group.
In the clustering masterclass we had at STOR-i with Brendan Murphy, our focus was the model-based approach. Here, a statistical model with a mixture of distributions is used, where each mixture component corresponds to a group. You could perform your clustering this way by iterating through models with different numbers of mixture components each, fitting them to the data each time, and picking the best model based on some criterion. Fop, Smart and Murphy (2017) use a special type of model-based clustering for categorical data called “latent class analysis”. Since they want to determine which of the diagnostic indicators are actually relevant, they also use a variable selection technique.
Now for the findings. Fop, Smart and Murphy (2017) took a data set on back pain indicators for 464 patients and clustered it. They also had the back pain diagnostic for each patient, but as the focus was reviewing the established medical methodology, this was set aside. After selecting the relevant indicators, they got the following results.

In short, they confirmed the established diagnostic methodology — as far as the model is concerned, there are indeed three types of back pain and they do mostly overlap with the established categories. Which is good news if you’re someone like me that sits on a chair for most of the day.
An interesting point is raised by class 2 having a significant number of patients with nociceptive pain as well. The paper reads
“Peripheral neuropathic [pain] (Class 2) is characterized by the presence of a dermatomal distribution of pain and pain on palpation of nerve tissue”
and I recall Brendan mentioning nociceptive pain and peripheral neuropathic pain are sometimes confused in practice when this symptom is present.
Further reading
Michael Fop, Keith M. Smart, and Thomas Brendan Murphy, Variable selection for latent class analysis with application to low back pain diagnosis, The Annals of Applied Statistics, 11(4):2080-2110, 2017


Great article!