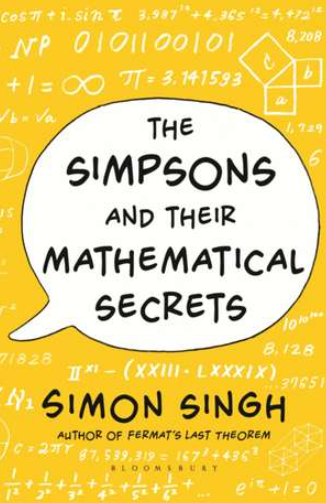
This blog is different from my others in that it has not been inspired by anything I have recently studied in my MRes course, but by a book I have read. In fact, this book is partially what inspired me to do a PhD in the first place. It was during the first lockdown and I had just finished my degree and although I had some ideas of my many hobbies and interests I was unsure of what path to take, let alone what my next step was. I found myself spending most of my days chasing the sunny parts of my garden while reading this book. It was while reading about all these different mathematical problems and how their solutions were found that I realised that was what I wanted to do. That or be a comedic writer, but as you may have noticed I don’t quite have the knack for that. I guess by this point you are wondering what book could have inspired me so much. Well here it is:

I appreciate that it may not be the most intellectual mathematic book on the market but I promise you it is clever, and if like me you are a fan of both the Simpsons and mathematics, you should read it!
I’m not here to tell you about the whole book, I just want to talk about an area of mathematics it touches on. (I’m not actually here at all you are reading this through a computer screen). This topic not only appears in the Simpsons episode ‘MoneyBart’ but also in the film Moneyball (which I also recommend you watch).

It is of course statistics in baseball. The game of baseball is said to be revolutionized by a man named Bill James. Bill James wasn’t a baseball player or even a coach or manager, in fact many of his revolutionary ideas came about when he was working as a security guard at a pork and beans canneray.
So how did he revolutionize baseball? You’ve probably realized by now he did it using statistics. Bill James noticed that the statistics currently being used to evaluate players weren’t appropriate or were being misunderstood. An example of this is fielders were evaluated on the numbers of mistakes made. This seems fair however if you look at what counts as a mistake it is not a fair evaluation. A fielder who is faster and gets to the ball quick but fumbles to catch it would class a mistake but a slow fielder who wouldn’t even get near the ball would be fine. Obviously you were prefer to have a fielder who gets close to the ball hence using this statistic to pick a team would be a mistake.
Bill James developed a statistic seemingly more relevant to evaluate a fielders performance: Range Factor as detailed here. The range factor is calculated by dividing the sum of assists and putouts by the number of innings or games played. Just in case you are not familiar a putout is given to a player when they record an out. This can be done in many ways which are described here. An assist is rewarded to a player when they touch the ball prior to a putout. For more information check out here. Instead of observing errors this statistic shows how often a play does something well, which is easier to observe, therefore making it a better evaluation of a player.
Another analytic devised by Bill James is the Pythagorean Expectation, again detailed here. This analytic is used to estimate the number of games a team should have won given the number of runs allowed and runs scored. It is also used to make predictions as well as evaluate which teams are over or under performing. The expected number of wins is the number of games played multiplied by something called the win ratio. The win ratio is

This analytic has not only been used in baseball but also basketball, ice hockey and American Football.
If you rushed off to watch Moneyball before finishing this blog then you will know that in 2002 baseball team the ‘Oakland A’s’ used statistics to change how they play. This led to them winning 20 consecutive games setting an American League record and changing the game of baseball. To learn more read the book Moneyball or look here.
