Random Graphs

A graph is a pair \( G = (V, E) \) where \(V\) is a set of whose elements represent the verticies of the graph and \(E\) is a set of pairs of vertices that represent the edges of the graph. This is better explained with an example:
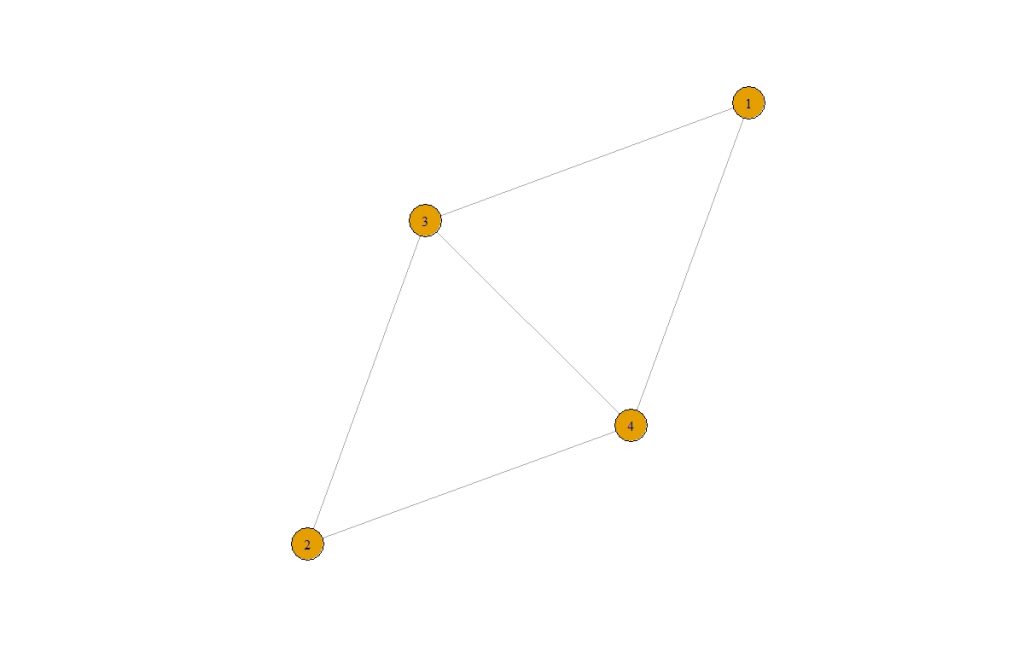
Here we have \(V = \{1,2,3,4\} \) and \( E = \{ \{1,3\} , \{1,4\}, \{2,3\} , \{2,4\} , \{3,4\} \} \)
With this basic framework we can generate a random graph, the simplest of which being the Erdős–Rényi model. The method is simple, first decide on the number of vertices \( |V|= n \) and a value \( p \in [0,1] \). Now for every possible edge we include it with probability \(p\) independently of every other edge.
Thus the probability of a single edge existing is a \(Bernoulli(p)\) random variable. There are \( {n \choose 2} \) possible edges and so \( \mathbf{E} [ |E| ] = {n \choose 2} p \).
Another interesting property we can look at is the expected number of triangles found in the graph. A triangle exists if, like you would expect, there are 3 vertices all connected with edges. Calculating this is simpler than it might first sound…
There are \( t = {n \choose 3} \) possible triangles in our graph of n vertices. Now define random variables \( X_1, \dots, X_t \) such that \( X_j = 1 \) if triangle j exists and \(0\) otherwise. Note due to how we are constructing our graph these random variables are independent and identically distributed so we do not need to worry about how we are assigning a random variable to a triangle. Then we have:
$$ \begin{align} \mathbf{E} [no. triangles] &= \mathbf{E} \left[ \sum_{j=1}^t X_j \right] &&\text{(by definition)} \\ &= \sum_{j=1}^t \mathbf{E} [X_j] &&\text{(by linearity of expectation)} \\ &= t \mathbf{E} [X_j] &&\text{(iid)} \\ &= tp^3 \end{align} $$
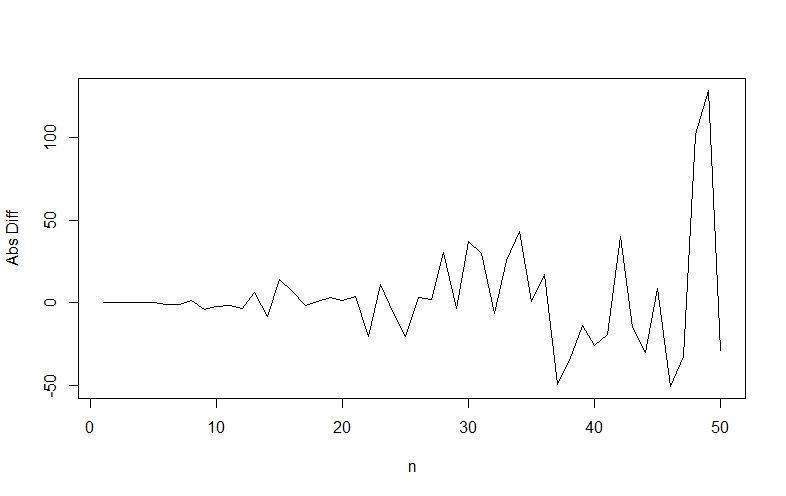
This seems a very simple result so to verify it I ran a simulation in R to check it out.
You can use my code to see for yourself if you would like:
rm(list = ls())
require(igraph)
set.seed(1)

#### Model Parameters
n.vec = 1:50
p = 0.5
reps = 10

#### Function to create a erdos-reyni graph
erdos <- function(N, p, plots){

  E = choose(N, 2)
  edges = rbinom(E, 1, prob = p)

  A = matrix(0, nrow = N, ncol = N)
  A[lower.tri(A, diag=FALSE)] = edges
  A = t(A) + A

  graph = graph_from_adjacency_matrix(A, mode = "undirected")

  if (plots == TRUE){
    plot(graph)
  }

  return(list(graph = graph, triangles = length(cliques(graph, min=3, max=3))))
}

#### Simulation
clique.vec = rep(0,length(n.vec))
for (i in 1:length(n.vec)){
  for (j in 1:reps){
    clique.vec[i] = clique.vec[i] + erdos(n.vec[i], p, FALSE)$triangles
  }
  clique.vec[i] = clique.vec[i] / reps
}

plot(n.vec, clique.vec - choose(n.vec,3)*p^3, lwd = 1,  type = "l", xlab = "n", ylab = "Abs Diff")