
I’m sure all of you have heard about networks in one way or another; perhaps you cast your mind instantly to the idea of Facebook friends upon reading this post, and not only thanks to my rip-off of a certain film title. But what are networks actually used for, and what inference can be made from them?
“We assume the data to be independent and identically distributed” – if I received £1 for every time I heard that phrase during my first week in STOR-i, I would have very little need for a stipend. This is because it is common in statistics to be working with independent and identically distributed data – and this means that making inference from the data is nice and easy.
Network data poses more challenges than traditional independent and identically distributed data. One reason for this is that there is a dependent nature to the data. This makes sense; consider a Facebook page called Lancaster University Ducks, which posts the best pictures around of our campus ducks.
You choose to like this page, as you like receiving all the best duck updates. Then, it is more likely that one of your university friends also likes this page, compared to a random person who is not a member of your network.
Let’s consider another example of a network – a recommendation system. If, like me, you have been binging all the latest Netflix titles over lockdown, then you have probably come into contact with this form of network.
When you finish watching a series in Netflix, you may have noticed that other TV shows are recommended to you. This similar to when you shop online; perhaps you are familiar with the ‘similar shoppers also bought…’ suggestions. This idea can be modelled as a network…
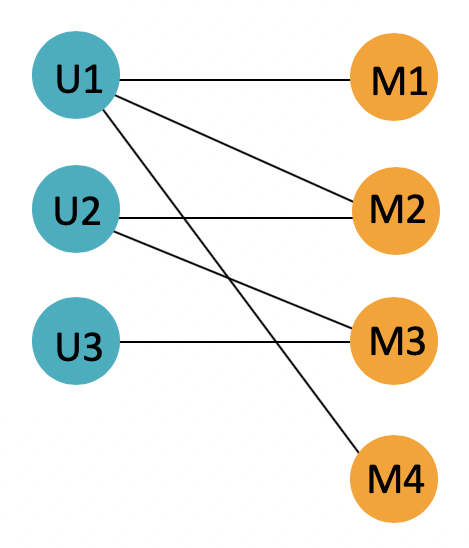
This figure demonstrates a basic recommendation system network. The coloured circles are called nodes, or vertices. In this case, the blue nodes on the left represent users, and the orange nodes on the right represent movies. Nodes can be given any name in a network; here I could have given names of STOR-i lecturers or recent Netflix releases.
The lines linking particular users to particular movies are called edges. It is possible for edges to be directed (usually shown by having an arrow pointing along the edge), or weighted. Weighted edges have a number (or weight) associated with them. In our recommendation system case, a weighted edge could perhaps indicate the number of times a user has watched a particular movie.
Using our network, we can see that User 1 watched movies 1, 2 and 4, meanwhile User 2 watched movies 2 and 3, and so on. Now, imagine that a fourth user joins our network. User 4, our new user, is the same age as User 2, and both users live in the UK. Therefore, a recommendation system might want to suggest that User 4 also watched movies 2 and 3.
The degree of a node is the number of edges connecting to that node. Looking back at our network, we can see that the degree of the User 1 node is given by 3, and there are three edges connected to this node. The degree of the User 2 node is given by 2, and so on.
Using the degree of the nodes in a network, it is then possible to calculate a degree distribution. The degree distribution for a network denotes the proportion of nodes with a specific degree, and can be used to compare network models to real networks.
There you have it – a super quick introduction to networks! Can you think of any other situations which could be modelled as networks? What about directed networks? Let me know in the comments!
If you are interested in reading more about networks, and finding out some network models that exist, then make sure you check out the further reading for this blog post!
Further reading
This blog post about network models for recommender systems is really interesting, and great for beginners!
Another great post about network models and recommender systems can be found here. This is one of a series, and is written from a data science perspective.
The Erdos Renyi Model is a well known network model, first introduced in 1959 by mathematicians Paul Erdős and Alfréd Rényi. Check out this useful blog post, which introduces the model and also provides some code for generating a graph using this model.
Another well known network model is the Preferential Attachment Model introduced by Barabasi and Albert. These useful lecture notes explain how this model works in mathematical detail, as well as a few other network models.