Fossil fuel burning, farming livestock and cutting down forests results in
CO2 and other gases being released into the atmosphere where they act as heattrappers. This causes the Earth’s surface temperature to rise. Global warming is a hotter topic each year and UN countries pledged to make effort to limit its extent by limiting CO2 emissions and other environmental actions [1]. Even though there is no doubt about global warming nowadays, the evidence is typically not explained in media. The explanation is complicated by the fact that the monthly average temperature may vary significantly from the long-term mean,
which conceals the rising temperature trend. There are also seasonal events
caused by natural processes that have effect of jumps between yearly average temperatures. Further complications are rare events of extreme cold or extreme heat. This is perhaps why many may be left doubtful about the statistical evidence of global warming. Anyways, how do we know a warm winter is a result of rising temperature and not just a natural fluctuation between years? We are dead sure that temperatures we see in the last few decades are higher than they used to be and we can show it on a simple study of monthly average temperatures.
Since there are many locations on Earth where temperature is measured,
the task can be simplified by studying only one location. The data are from
Košice International Airport meteorological station in Slovakia but resemble climate patterns of many other European locations. The temperatures are daily average from January 1, 2009 to December 31, 2022. Data also contain daily temperature averaged over years 1980 to 2010 called the long-term mean. The long-term mean gives an expected temperature on a given day if there is no other information. With statistical tools like hypothesis testing, we can show the rising temperature trend.
Hypothesis testing explained
Statisticians have methods that suggest how confident we can be that the mean temperature has risen and how much. Statistical significance is a common measure when testing hypothesis such as rising temperature. In theory, we would need infinitely many temperature measurements to show a positive trend. In practice, we have limited data and evaluate likelihood of the hypothesis. For example, 95% confidence level means we reject hypothesis if it is outside of the interval that covers 95% of possible outcomes [4]. We can illustrate the concept of confidence interval on a very simple example. 95% of daily temperatures in January are between -9.8 and 5.8 degrees Celsius, 2.5% temperatures are colder than -9.8 and 2.5% temperatures are warmer. If we test the hypothesis that a
temperature of 6.8 degrees was recorded in January, we would reject it as it falls outside the confidence interval, even though this temperature was recorded on January 6th, 2014. Through the hypothesis testing, we can make conclusion about how likely they are and reject them if their likelihood is below 5%.
The first hypothesis is no warming which means that the difference between daily temperature and 1980-2010 long-term mean is expected to be zero. Then, if rejected (as we would expect), the second hypothesis is zero gradient, which means no significant temperature rise from 2009 to 2022.
Both hypotheses assume independent data. Daily temperatures are clearly
dependent since the temperature today depends on yesterday’s temperature. However, the dependence of monthly mean temperatures is negligible. Therefore, the data are aggregated to a monthly level and assumed to be independent.
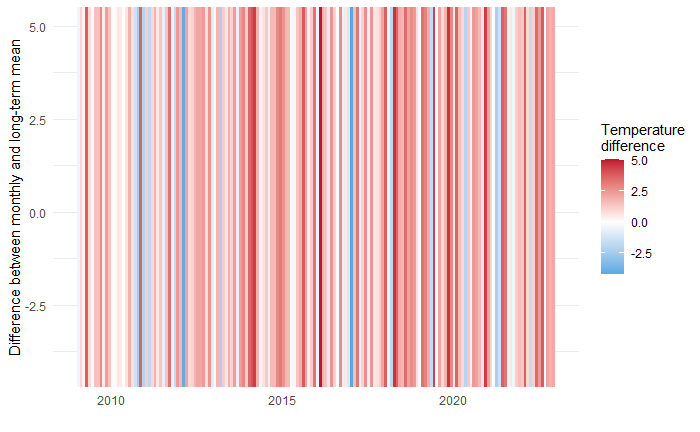
The plot below shows the difference between the monthly and long-term
mean but instead of plotting the value of the dots on the y-axis, the colour of each monthly interval is given by the monthly value. Blue means the month was colder than the long-term mean and red means the month was warmer than the long-term mean. First, the plot looks more red than blue which suggests that the temperature has risen when compared to 1980 – 2010. This is clear visual evidence against the first hypothesis of no warming. Second, as you go from left to right, the blue is getting more pale and there seems to be more red. This would mean there is further warming recorded during the 14 years, which is an evidence against the second hypothesis of zero gradient.

The magic of t-test
The t-test was developed by William Sealy Gosset, who published his results of quality testing of beer at Guiness brewery under the ‘Student’ pseudonym. Gosset was interested in the probability of different beer samples coming from the same source. Nowadays, the t-test is commonly used in statistics and can be used to determine if 2009-2022 monthly difference from long-term temperatures could have 0 mean and if the difference has zero gradient. The two hypotheses are tested by one sample t-test and linear regression t-test with two possible outcomes: reject or do not reject.
Could there be no warming compared to 1980 –
2010?
One sample t-test can be used for no warming hypothesis, in which the sample of temperature differences is expected to have 0 mean. The outcome of the test depends on the value of t statistic that depends on the sample mean, the sample size (168 months) and the standard deviation. Some intuition behind the formula is that the bigger sample mean and sample size makes t larger and towards reject interval while bigger deviation in the determinant will make t smaller and towards do not reject interval. This is intuitive since bigger variance makes us less confident about rejecting a hypothesis. It is no surprise that the calculated t of 9.8 has probability 2.2*10-16 hence the rejection of the no warming hypothesis is as clear as day.
Could there be no warming from 2009 to 2022?
Our hypothesis is a constant linear model with zero gradient, which would mean no further warming during the 14-year period.
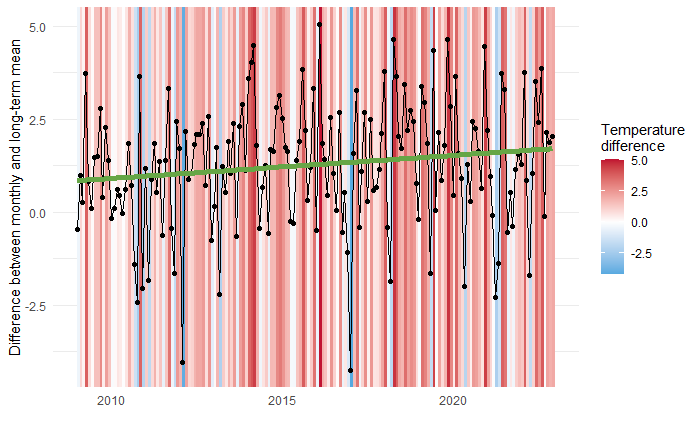
Linear regression model implemented in R produces an intercept of 0.85
degrees Celsius and the gradient 0.005, which is shown by the green line in the plot below. This means that the temperature has risen on average 0.005 degrees each month in the past 14 years or roughly 0.835 degrees between January 2009 and December 2022. The rate is alarming but the measure is subject to some error due to variance. Therefore, only considering the 2009 – 2022 period means that the linear trend is just on the edge of statistical significance. Gradient equal to 0 is rejected, but only on
the usual 95% confidence level. If stricter confidence levels are required, longer time interval or different methods are needed.

Temperature is rising . . .
Continued temperature rise suggested by the colour pattern of the monthly temperature difference is supported by the one sample t-test and the linear regression t-test. It is statistically impossible to deny an increase in temperature in years 2009 – 2022 compared to 1980 – 2010 period. It is also rejected that the temperature difference remained constant within the 14-year period, which means that the rising temperature trend continues. More sophisticated methods applied to many different meteorological stations support this conclusion on a global level. However, global average temperature increase conceals the fact that the land is warming faster than the ocean, especially in the higher latitudes of the Northern Hemisphere [5].
Even though the level of warming depends on the geographic location, it is happening globally and different methods point to the same conclusion that the Earth is getting hotter and not in an attractive way. If you are interested in where the data came from or the exploratory data analysis process, please visit the GitHub repository.
References
[1] For a livable climate: Net-zero commitments must be backed by credible action. https://www.un.org/en/climatechange/net-zero-coalition. [Online; accessed 24-December-2024]. [2] Global Climate Change: Vital Signs of the Planet. https://
climate.nasa.gov/vital-signs/global-temperature. [Online; accessed
24-December-2023].
[3] How Do We Know Climate Change Is Real? https://climate.
nasa.gov/evidence. [Online; accessed 15-April-2023].
[4] Drummond, G. B. and Tom, B. D. (2011). Statistics, probability,
significance, likelihood: words mean what we define them to mean. Journal
of Physiology, 589(16).
[5] Hawkins, E. (2023). Warming Patterns. https://www.climate-lab-book.
ac.uk/2021/warming-patterns. [Online; accessed 15-April-2023].
[6] Shea, D. (2023). Trend Analysis. https://climatedataguide.ucar.edu/
climate-tools/trend-analysis. [Online; accessed 15-April-2023].
[7] Stocker, T., Qin, D., Plattner, G.-K., Tignor, M., Allen, S., Boschung, J.,
Nauels, A., Xia, Y., Bex, V., and (eds.), P. M. (2013). Climate change 2013:
The physical science basis. Technical report, Intergovernmental Panel on
Climate Change (IPCC).
[8] Storch, H. v. and Zwiers, F. W. (1999). Statistical Analysis in Climate
Research. Cambridge University Press.
[9] Woodward, W. A. and Gray, H. L. (1993). Global warming and the problem of testing for trend in time series data. Journal of Climate, 6(5).