Is there a way that a screenwriter can to choose to write their film to increase the chances of it being more profitable? A paper recently published within the Journal of the Operational Research Society, (Del Vecchio et al [2020]) looks at using emotional arcs of films to drive product and service innovation in entertainment industries. Their hypothesis was that a particular type of emotional arc can be more profitable, perhaps in certain genres or just overall. Looking at the emotional arc is just a way of quantifying the highs and lows of a film, so things such as when there is a very sad scene or a extremely happy ending.
They began by extracting files containing subtitles from https://www.opensubtitles.org and removing duplicates (choosing the most popular version where they existed). They also attached information from IMDB, movie revenues and budgets to use within later analysis.
They split the subtitles into sentences and analysed each word in the sentence, giving it a “sentimental value” (1 if emotionally positive, 0 if emotionally neutral and -1 if emotionally negative) based on a lexicon that was developed in the Nebraska Literary Lab. From this an overall sentence sentiment value for the sentence was found so-called between [-1,1]. So direct comparison could be made between films of different lengths, a representive sub-sample of these sentiment values was taken with 100 elements as to represent the % of time within a film. This set of 100 sentimental values throughout time is refered to as the emotional arc or trajectory or the film.
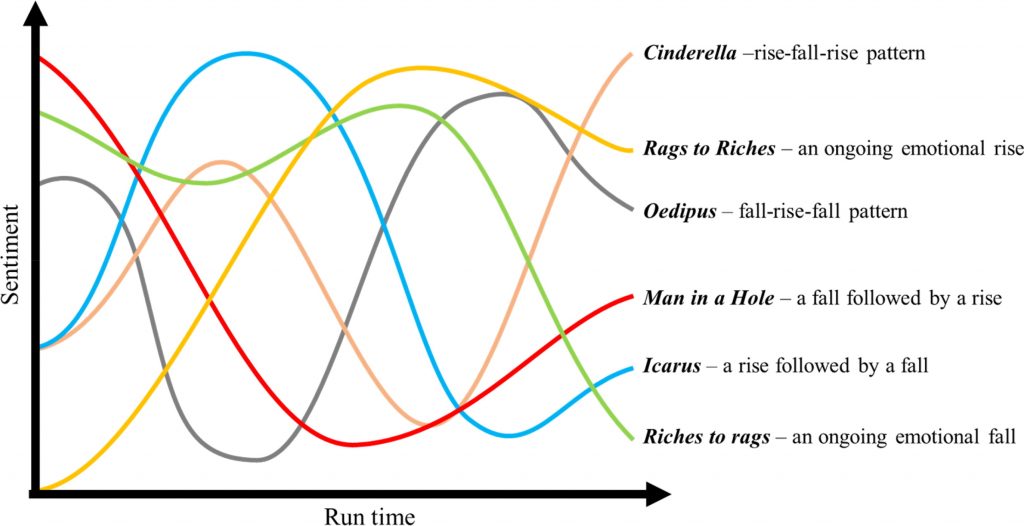
Previous work on a similar area had already found that novels can be partitioned into 6 clusters based on their emotional arcs:
- Rags to Riches – an ongoing emotional rise. Examples in film are The Shawshank Redemption and The Nightmare Before Christmas.
- Riches to Rags – an ongoing emotional fall. Examples in film are Monty Python and the Holy Grail and Toy Story 3 (this suprised me).
- Man in a Hole – a fall followed by a rise. Examples in film are The Godfather and The Lord of the Rings: The Fellowship of the Ring.
- Icarus – a rise followed by a fall. Examples in film are Mary Poppins and A Very Long Engagment.
- Cinderella – a rise-fall-rise pattern. Examples in film are Babe and Spider-man 2.
- Oedipus – fall-rise-fall pattern. Examples in film are The Little Mermaid and As Good as It Gets.
Within their paper they argued that many novels are made into films and from this they hypothesised that films would follow the same 6 clusters as novels. Using this assumption of 6 clusters that the sentiment data generated from the subtitles they used a k-means clustering approach to partition their list of films into the aforementioned groups.
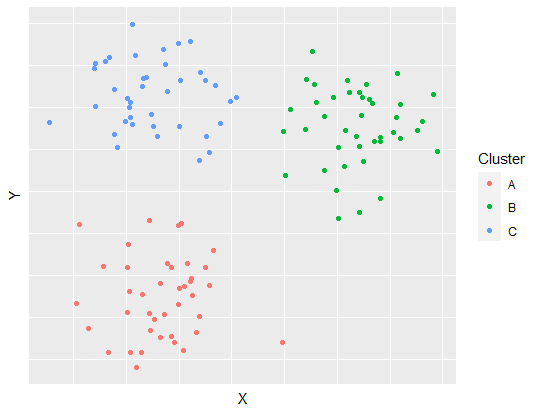
k-means Clustering
k-means clustering involves grouping data into \(k\) clusters based on the distance from the mean. Here is a simple step by step overview of how a k-means clustering algorithm works.
- Choose an \(k\) arbitrary points within the data. These will be the inital clusters.
- For each of the remaining points measure the distance to each of the \(k\) clusters and assign each point to the cluster it is nearest to.
- Find the mean of each cluster and, for all the points, find the distance from each of these means. Asign each point to the cluster whose mean the point is closest to. This is now the new set of clusters.
- Repeat the process in step 3 of finding the mean of each cluster and reassigning the points to the cluster whose mean it is closest to until the clusters do not change.
- As this is dependent on the chosen starting points, steps 1 to 4 is repeated a chosen number of times.
- The variance for each cluster is measured each time and the final clustering is chosen to be the one which gives the smallest variance.
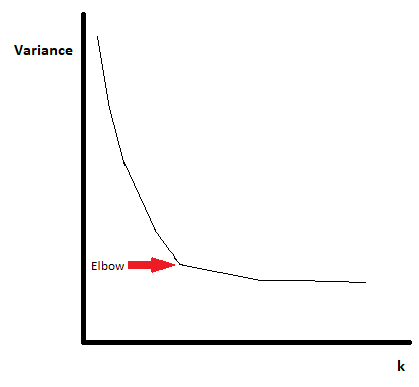
One thing that needs to be considered is how we choose the value of \(k\). Unfortuantely there is no automatic way to choose this therefore usually the best way is to try different values of \(k\). Starting with \(k\)=1, do the k-means clustering algorithm and record the total variance for each \(k\). The variance should begin as just the variance of the whole dataset for \(k\)=1 and will decrease as \(k\) increases. However often this decrease in variance will begin to slow down more rapidly after a certain value of \(k\). This is the value of \(k\) you would then choose to be your number of clusters. This method is known as the elbow method as if you plot the variance for each value of \(k\), there is often a distinct elbow shaped bend at the “optimal” number of clusters.
Here this was explained for individual data points, however k-means clustering can be done on a set of points. Within the paper being discussed here the approach was to find the distance between two sets of points at each time point and minimise the total off this.
Use within the paper
For two points at the same time percentage value \(t\), the distance was calculated by using Simpson’s rule to approximate the \(L_2\) metric, that is: $$ ||X_i(t) – X_j(t)||^2 = \sqrt{\frac{1}{\omega(t)dt} \int |X_i(t) – X_j(t)|^2 \omega(t)dt} $$ with \(\omega(t)\equiv1\).
The justification given for using k-means clustering here was:
- It is one of the most popular clustering techniques.
- Allows the user to obtain meaningful intuition regarding the data structure.
- Assumes spherical shapes of clusters which was found in previous natural language processing research.
- More intuiative compared to other methods.
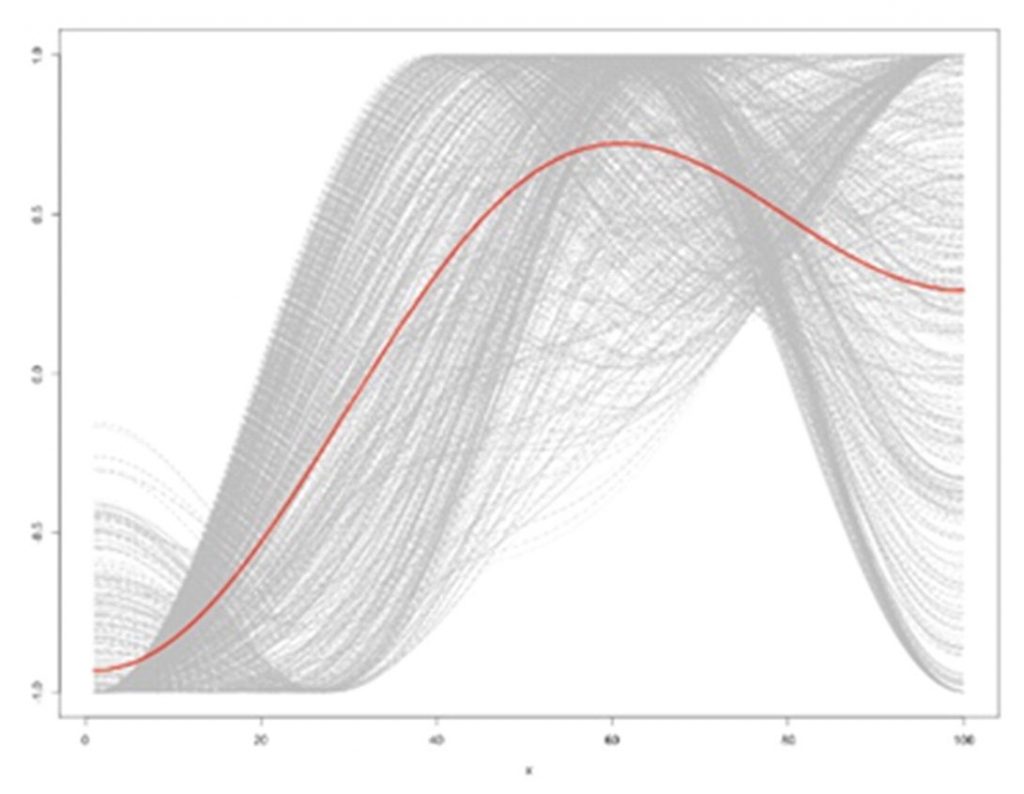
They tried various numbers of clusters (4, 6, 8, 10, 12) and found that the films did seem to fit optimally into the 6 partitions so their hypothesis was true. Below are the graphs showing each of the clusters found.
Rags to Riches 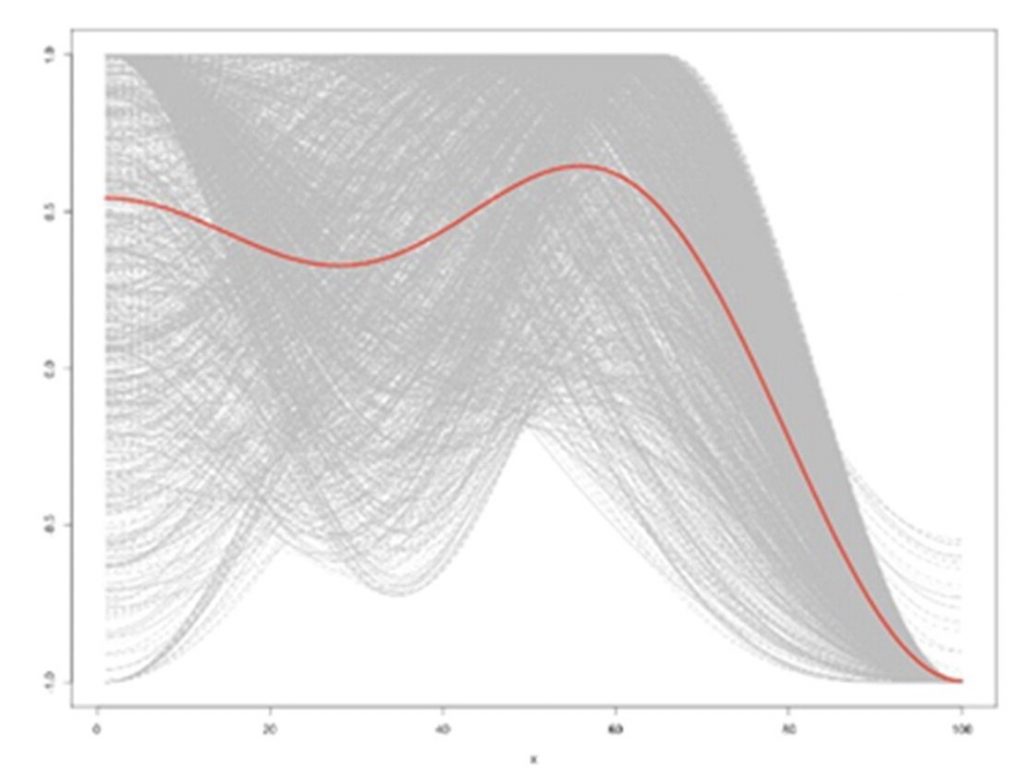
Riches to Rags 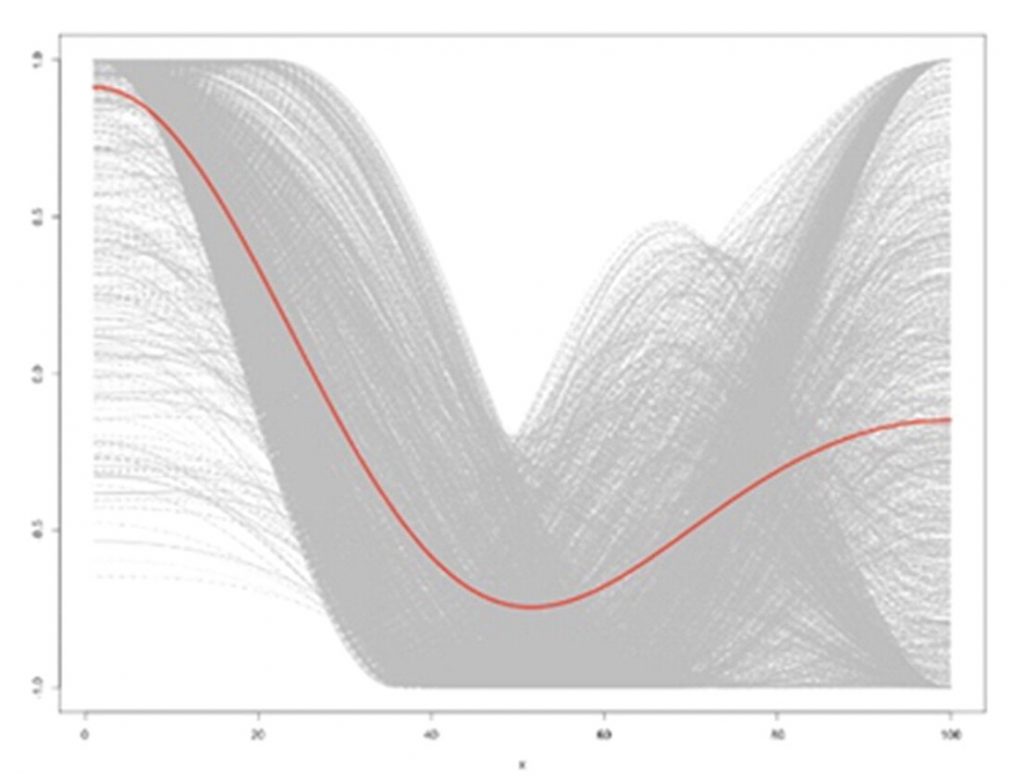
Man in a Hole 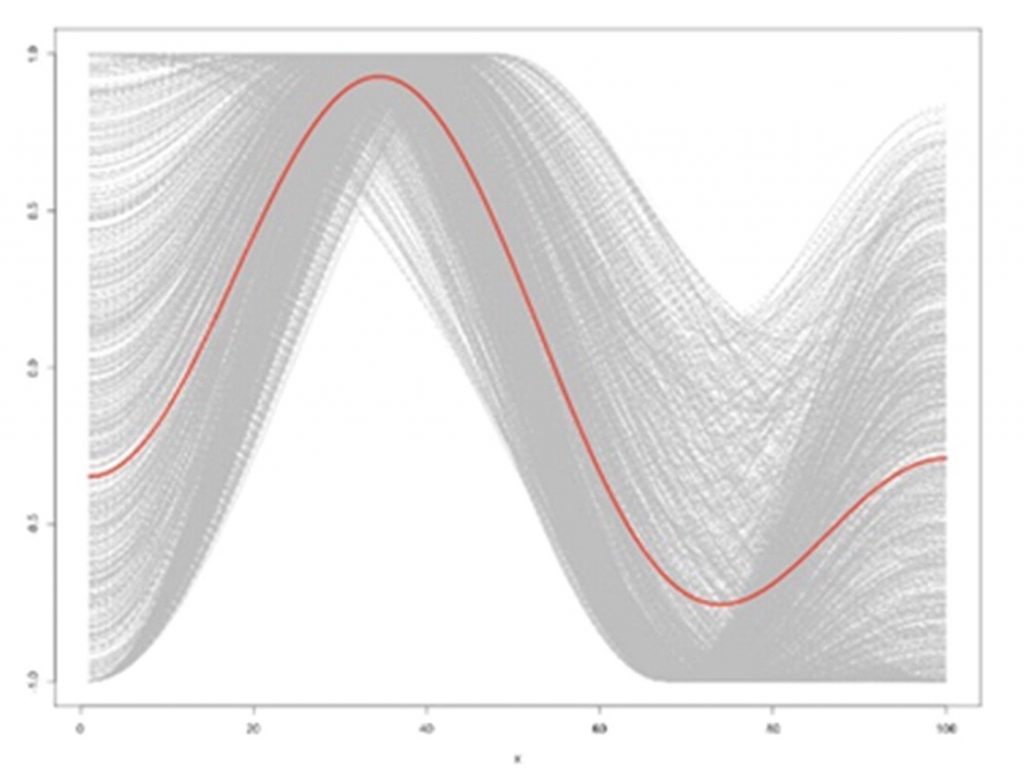
Icarus 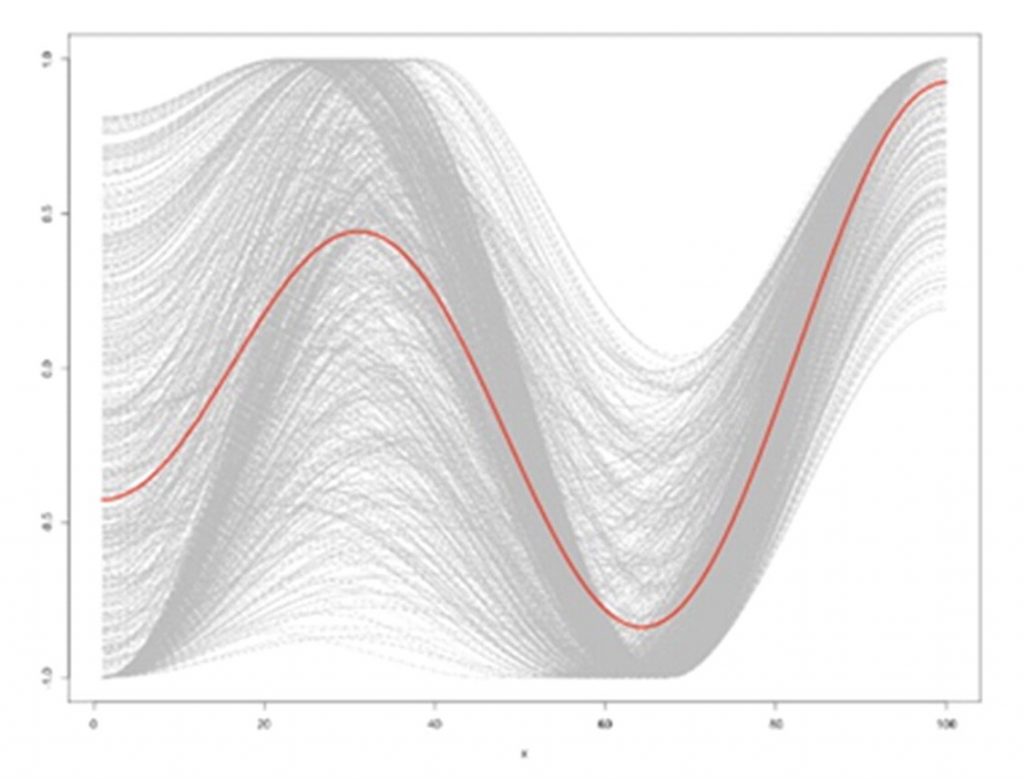
Cinderella 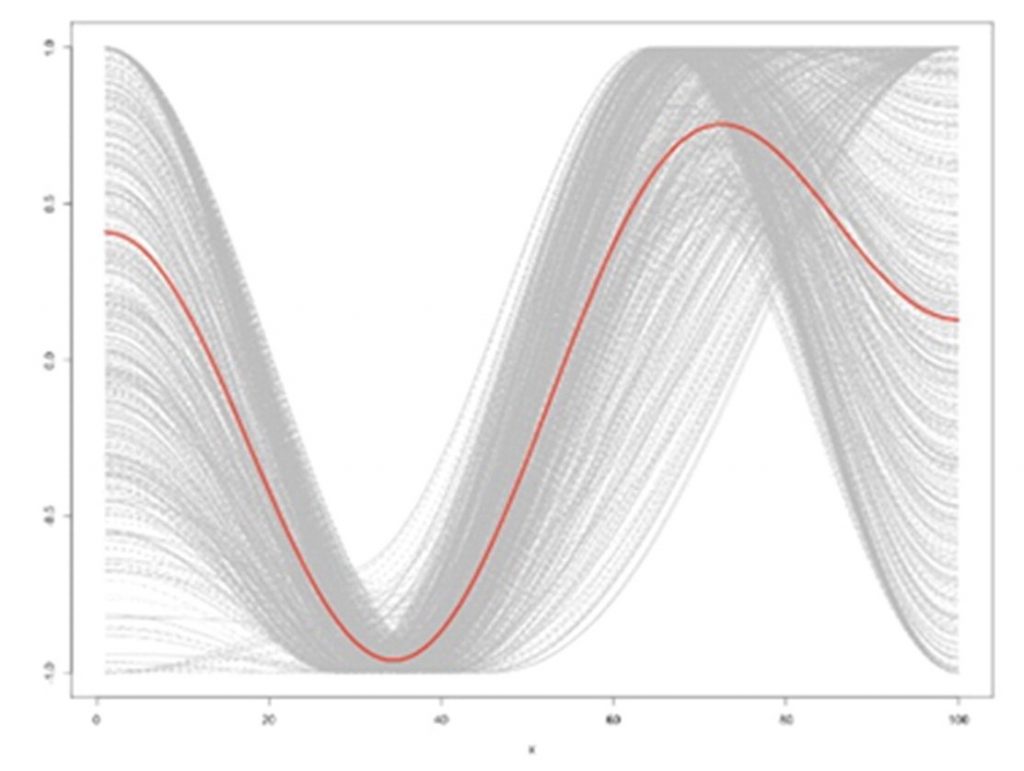
Oedipus
A number of Ordinary Least Squares (OLS) regression models for each of the emotional trajectories were used to determine if differences in revenues was statistically significant. OLS regression involves fitting a linear line equation to the data which minimises the sum of the squared deviations (a.k.a the error or residual) of each data point from the line. This is basically just finding the line of best fit.
Findings
Some of the interesting findings from the paper are:
- While Man in a Hole films tended to have the highest revenues, they tended to have lower IMDb ratings than other arc types leading to the belief that these films did well not necessarily because they were the most like but rather because they were the most talked about as they are often unusual and spark debate.
- The financial success of Man in a Hole emotional arc films is not due to them falling within any particular budget category.
- Generally a Riches to Rags emotionally arc is the least financially successful one however when they are in the high budget category they seem to generate statistically significantly high revenue.
- While Icarus films tend to be financially unsuccessful irrespective of the genre, again Man in a Hole films tend to generate high revenues across most genres.
There are a lot more in depth findings included within the paper, for these and the whole methodolgy and driving factors see the references at the bottom of this page.
So it sounds to me that if you’re currently writing you’re next blockbuster, maybe consider taking the viewer on a to an emotional low followed by an emotional rise as in the Man in a Hole emotional arc and maybe don’t spend too much money as it doesn’t matter either way. While I think it is interesting idea to plan a storyline around this emotional journey, if all films were made to follow this Man in a Hole pattern it could be that viewer became bored of this so it’s not likely that a recommendation to only do this is smart.
References
Marco Del Vecchio, Alexander Kharlamov, Glenn Parry & Ganna Pogrebna (2020) Improving productivity in Hollywood with data science: Using emotional arcs of movies to drive product and service innovation in entertainment industries, Journal of the Operational Research Society, DOI: 10.1080/01605682.2019.1705194
K-means clustering, k-means clustering – Wikipedia