Introduction
It is usually impossible to measure every member of a population to work out properties of the population. Instead, we use randomly sampled data from a population and Statistical Inference to estimate these properties instead. Note: Population here doesn’t necessarily mean a group of people, it can mean a group of objects, amounts or events etc.
Suppose we have a large collection of coloured balls and we want to try and infer a statistic such as the mean value of the diameter of the balls using a sample of nine balls. If we took the mean of this sample and then took a new sample of nine balls we would expect that the mean values would be different. Furthermore, if we took many new samples we would begin to obtain a distribution of sample means known as the sampling distribution. The sampling distribution is an important thing to consider because it gives an idea of how likely the mean we get for a given sample is to occur given the population.
In reality we will only take a single sample mean but we can think of it as one of many sample means we could have got. In many cases the sampling distribution of the means is expected to be approximately shaped like a normal distribution with mean equal to the mean of the population. This is justified by the Central Limit Theorem. In this case it is possible to get an idea of how much the sample mean will differ from the true population mean on average using standard theoretical results to calculate a quantity known as the standard error.
But what can we do when the sampling distribution is not expected to look like a normal distribution as is the case for different statistics of interest such as the median or when we can’t assume that the sampling distribution will be normal. In this case we can use a technique known as Bootstrapping, where we resample the sampled data many times to generate a sampling distribution for a given statistic from which we can calculate a standard error for that statistic.
BOOTSTRAPPING
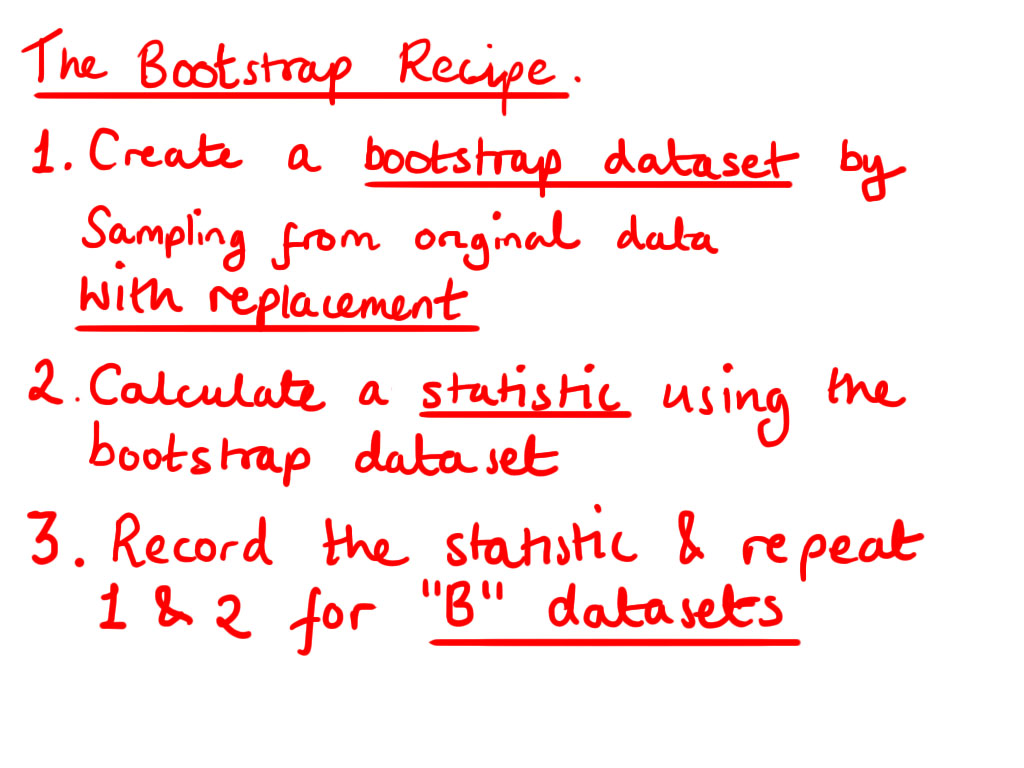
Lets go back to the example of the coloured balls to demonstrate how bootstrapping can be used to generate a sampling distribution for the median diameter of the balls. Imagine we have the original sampled dataset as a physical set of balls in a glass jar. To generate one bootstrap dataset imagine grabbing a ball out of the jar at random, noting it’s diameter and then putting it back. This process of selecting balls is repeated until you have noted down a set of balls that is the same size as the original sample. This set may contain repeated observations of the same ball because it was placed back into the jar between selection. This method of sampling is called sampling with replacement.


An example dataset generated by sampling with replacement is shown above. The next step is to calculate the statistic of interest for this dataset. In this case, the median of this sample is 9. Now comes the key part of bootstrapping. Repeating the resampling and calculating the statistic for “B” datasets. Here B is a placeholder for a large number. The choice of B is up to you but typically it is 10,000 or more. This may seem like a very large number but a computer can perform all the sampling and calculation in seconds. We can obtain a value for the standard error of the median by working out the standard deviation of the bootstrap samples known as the bootstrap standard error. By carrying out the bootstrapping procedure for the set of balls we can conclude that the bootstrap standard error of the median is 1.86.

conclusion
Bootstrapping is an incredibly intuitive and powerful tool in statistics, but it is important to note that it is not generating new data out of the blue. The central assumption of bootstrapping is that the sampled data you work with is representative of the population of the whole. When this is true, we can resample the sampled data to get an idea of the range of different possible samples that could be obtained from the population to create a sampling distribution.
Keep in mind that bootstrapping is not just useful for calculating standard errors, it can also be used to construct confidence intervals and perform hypothesis testing. So, be sure to have bootstrapping techniques in mind when you are faced with data that doesn’t appear to be workable with traditional techniques.
Relevant Links
Tutorial on bootstrap hypothesis testing in R


Best view i have ever seen !