Anomaly detection
As we had an overview of one of the unsupervised learning method, K-means Clustering, in my previous blog post, this post will introduce you to an another unsupervised learning method called Anomaly Detection. We should also note that Anomaly detection can be done using Supervised and Semi-supervised techniques as well.
What is an Anomaly?
Anomalies (Outliers) are patterns in data that do not conform to a well defined notion of normal behaviour. An unexpected change within these data patterns, or an event that does not conform to the expected data pattern, is considered an anomaly. In other words, an anomaly is a deviation from the usual happenings.
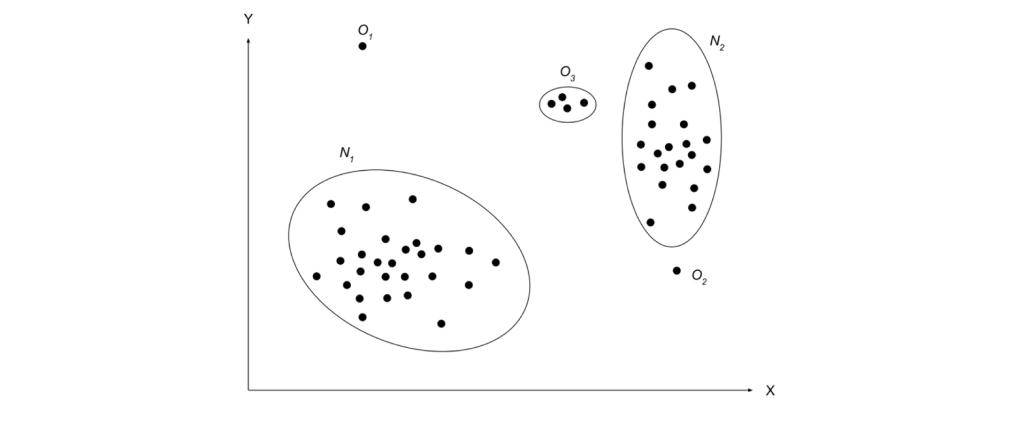
Red Occurences in Figure 1, describes the various anomalies that can occur. In Figure 2, We could observe most of the data occurences are in the region N_1 and N_2 . The points far off from these normal region, such as O_1, O_2 and O_3 are anomalies.
Anomalies can occur for various reasons. Customer acquisition costs, Malicious activity, Web page views, Revenue per click, Credit card frauds and more. These are valuable metrics for any data analyst and is considered advantage in decision making process. Therefore, Anomaly detection is an important process, which if efficient and timely can enable intervention and action to minimize or avoid effects of underlying cause. Even from a statistical context, anomaly detection helps the methods to be more robust and efficient.
Types of Anomalies
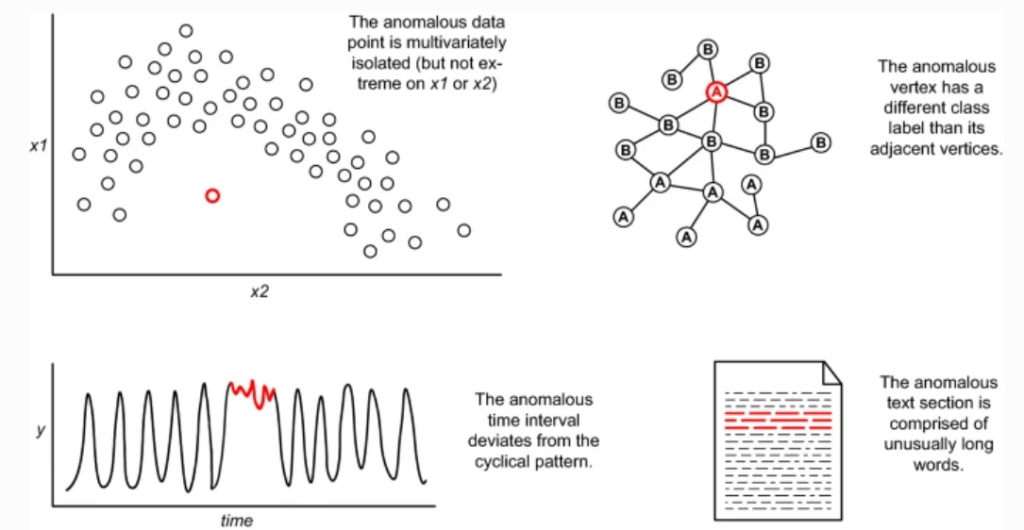
Anomalies are majorly classified into these three main categories which I will discuss below. However, there are wide variety of anomalies. If you are interested in learning various anomaly types and how it is distinguished, this paper could be helpful.
- Point Anomaly: A datapoint is considered an anomaly if its far outside or extremely away from other data points. It is also called as global outlier. For example O_1 , in figure 2, is a point anomaly.
- Contextual Anomaly: Contextual outliers are data points whose value significantly deviates from other data within some defined context. Also known as conditional outliers, its values are not outside global range but abnormal in comparison to the trend/period or seasonal pattern. For example, 20 ^\circ C on Christmas day.
- Collective Anomaly: Collective anomalies are defined as sequences of observations that are not anomalous when considered individually, but together form an anomalous pattern. In layman words, having all cars on the freeway move to the left lane simultaneously would be a collective outlier because, even though moving to the left lane is not uncommon, it is unusual for all cars to move at the same time.
With different types of data, we come across various types of outliers. If we consider database systems, we will have outliers like insertion, updation or deletion anomalies. In time series data, we have additive outliers, innovational outliers, level shift outliers, seasonal outliers and more. This documentation from IBM gives a general idea of understanding outliers in time-series data if you are interested.
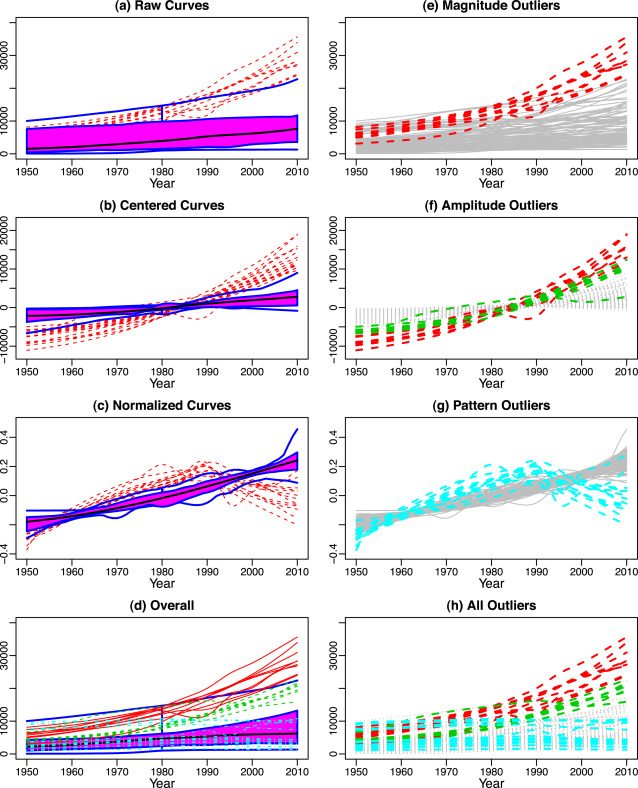
Data that appears in a variety of disciplines including biology, medicine, meteorology and engineering, like Functional data (type of data consists of curves varying over a continuum, such as time, frequency, or wavelength), we come across outliers like magnitude, amplitude and shape outliers.
- Magnitude Outlier: If any or one of the curve is outlying in some parts or across whole design domain.
- Amplitude Outlier: The curves with unusual oscillation levels
- Shape/Pattern Outliers: The curves with unusual shape or the ones that significantly differ from pattern exhibited by other curves even after centralizing and normalizing.
Source
Anomaly detection is the process of identifying these items or events in data sets that differ from the norm. Anomaly detection is often performed on unlabeled data, which is known as unsupervised anomaly detection. Anomaly detection is based on two assumptions:
- Anomalies occur very rarely in the data
- Their features differ significantly from the normal cases.
A business system that is considered normal today may not be so in the future. Most business systems change over time as the result of various factors. Best example is the current situation of Covid19, the whole world is experiencing. The unprecedented scenarios everywhere, which often is termed as the “new normal”, it was abnormal or anomalous outcomes earlier. These anomalous outcomes can result in positive or negative impact for any organization and are important to keep track of, for formulating a long term business strategy. Hence, anomaly detection in every domain is important and finding more effective ways to detect it will be most important skill in the future.
In my next blog, we will discuss more statistics, a method to detect outliers in functional data. I hope this post gave you an insight into what anomaly is and how anomaly detection matters.
Till then, I found this small game interesting, eyeballing and finding outliers. Try it for yourself if you could find.
Further Reading:
This blog could help you in basic overview of Anomalies. I have shared the links of few papers that can be of interest.
https://link.springer.com/article/10.1007/s41060-021-00265-1
https://www.sciencedirect.com/science/article/abs/pii/S0167947320300517?via%3Dihub
You May Also Like