So, we had the STOR-i conference last week. 2 days of interesting talks, free wine, and somewhat awkward photos.
Of the presentations, I was intrigued by one presented by Dolores Romero Morales, of the Copenhagen Business School (her personal website is here) mentioning a paper entitled “Enhancing Interpretability in Factor Analysis by Means of Mathematical Optimization”. Sadly, she ran out of time to go into this during the talk, so I decided to do a post discussing this paper.
But firstly, a background in factor analysis.
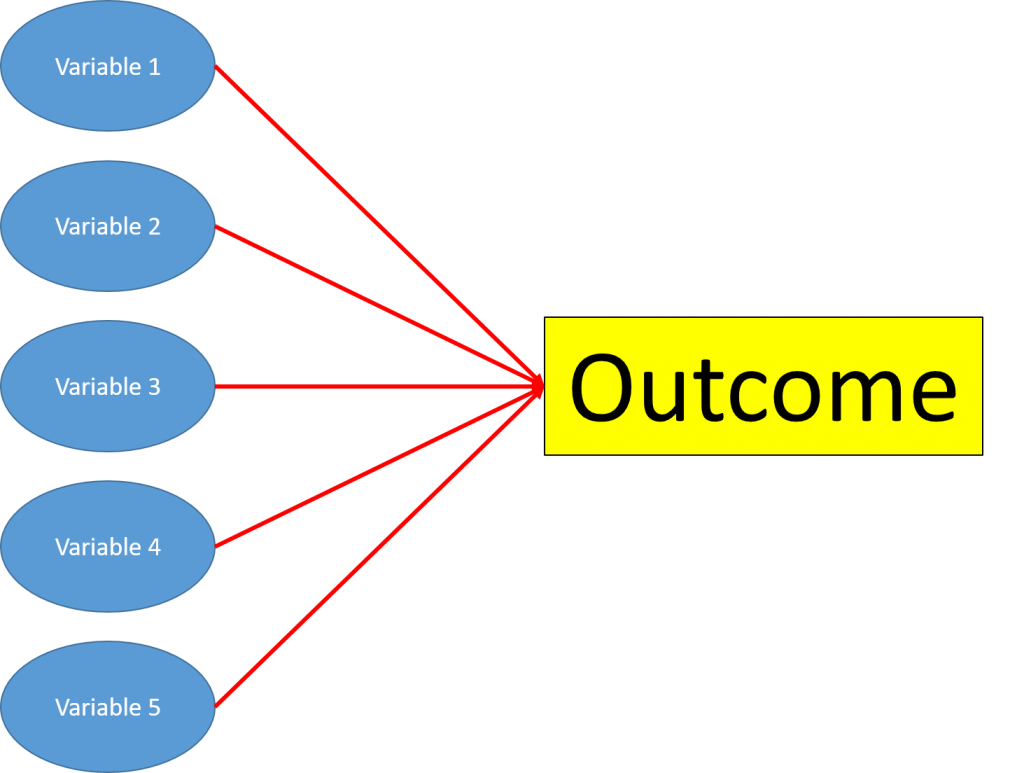
Factor analysis is a statistical method to try and reduce the number of important variables in a linear regression model. In a standard linear regression model, you have a number of variables, which you can see/observe, and you assume have a direct effect on the output.
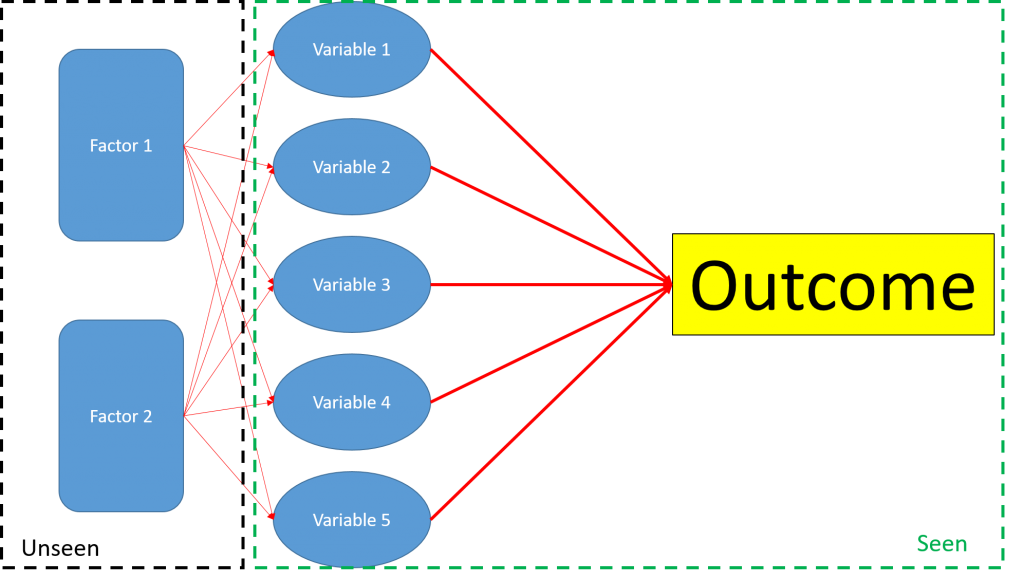
In Factor analysis, there are a number of latent variables called ‘Factors’. These are unseen variables, which affect the seen variables you would use in your linear regression. The factors affect this variables in the manner of:
Variable = Effect of Factor 1 + Effect of Factor 2 + …+ Some Random Error
You then use the variables to determine their effect on the outcome.
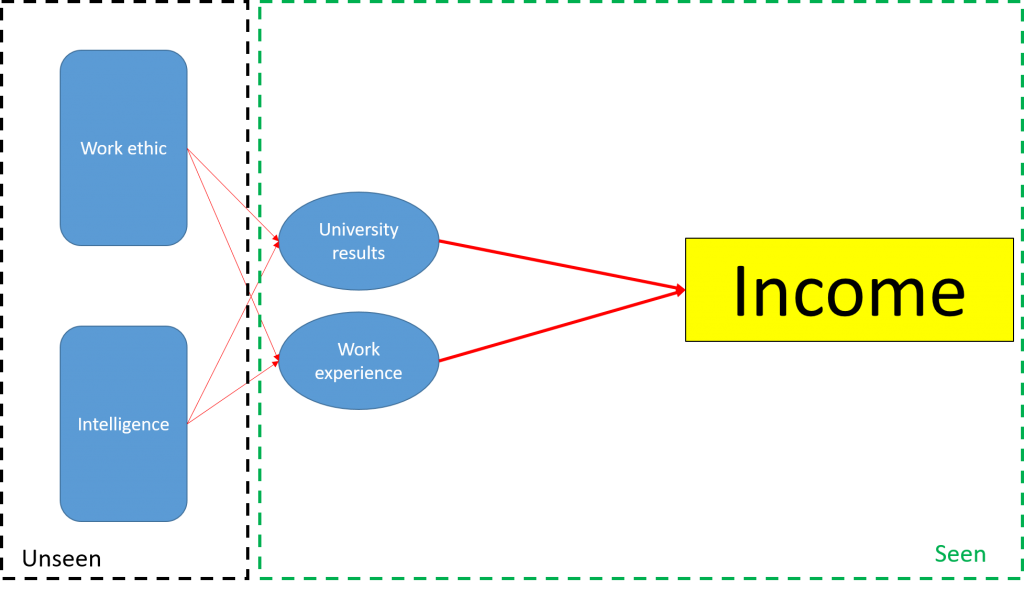
An example is a study in which researchers are trying to model the income of participants. One can imagine that some unobservable qualities – such as intelligence and work ethic – would influence how much a person will earn. However, we can’t measure these – we can only measure things such as university results and years of work experience. The idea is that the (unbserved) factors of intelligence and work ethic will influence the (observed) variables of university results and years of work experience, for example:
University results = Effect of Intelligence + Effect of Work Ethic + Random error
Then, you use the university results and work experience to model income, such as:
Income = Effect of University Results + Effect of Work Experience + Some more random error
Factor analysis can be used to:
- Examine if a hypothesised structure exists in the data – our toy example is an example of this
- Examine the data to see if there is any structure present.
The latter example is known as exploratory factor analysis. The paper I’m going to look at today looks at an extension of this.
Enhancing Interpretability in Factor Analysis by Means of Mathematical Optimization
I’m not going to lie, I was very excited when I heard the title of this paper. Communication in mathematics and statistics is always a problem. Data Science, just through the sheer number of observations and variables is particularly susceptible to this.
The paper is trying to solve the following problem. Let’s say in our example above, that you didn’t have any idea what the two factors were. So you plug your data into your software package of choice to do some factor analysis

The issue is, the model R your software package fits isn’t guaranteed in any way to fit factors that make intuitive sense. For example, in our example above, you could get a model which has 13 factors, of which 9 affect university results and 7 affect work experience, with no real pattern between them.
While there are many different ways of dealing with the interpretability of factors, the (extremely condensed) idea of the paper is that you can assign the different explanatory variables to clusters. Then, you can force the model to fit factors that match these clusters. Therefore, you can be sure that you will end up with factors that “make sense”.
Example – California Reservoir Levels
The authors in the paper trial their method on a dataset of California reservoir levels (from Taeb et al. 2017). They assign one variable to each cluster, chosing:
- Palmer Drought Severity Index
- Colorado River Discharge
- State-Wide Consumer Price Index
- Hydroelectric Power
- State-Wide Number of Agricultural Workers
- Sierra Nevada Snow Pack
- Temperature
as the seven variables, with one variable in each cluster. Therefore, when fitting the factors, we can tell that they will be related to one of these variables.
In fact, they find that the best fitting comes from having 2 factors – one for Hydroelectric power and one for temperature.
Issues with the paper
I’m torn here. On the whole, while I’m sympathetic to any attempt to make data science more accessible, I’m a bit confused by this paper (ironic, really). They assign each factor to a specific variable to make the model easier to interpret. But once this is done, it isn’t clear why this isn’t simply a linear regression. The whole idea is that factor analysis tries to find some hidden factors that govern the way the explanatory variables work. But for this approach, the factors are assigned to seen explanatory variables anyway, so it’s not clear what this process achieves. Furthermore, the code used in the paper isn’t available online, so it is hard to replicate what they’ve done and work out what they did for yourself.
However, I would be very interested to see how fitting models with these interpretability clusters to fitting standard exploratory factor analysis models. Having previously worked trying to explain complex data analysis to non-technical people, the idea that you could explain that your explanatory variables are governed by a simple, understandable process is golden. However, until I give this more of a go myself, I’m not sure how much this will add to the process.
1 thought on “Factor analysis and Interpretability”
Comments are closed.