During Summer 2018, I was a research intern at STOR-i. This involved working on a project supervised by a 1st year PhD student that focussed on their research area. The internship was extremely rewarding and helped me to gain an invaluable insight into life as a PhD student. I have provided an overview of my project in the research section of my website, but I have decided to detail this further as I think this is a very interesting application of statistical methods.
My project was titled “Estimating Diffusivity in the Ocean” and was supervised by Sarah Oscroft. Diffusivity is the rate at which particles spread out over time in a fluid. This has many important applications, for example:
– Planning aid in a search and rescue mission,
– Predicting how oil will spread after an oil spill to reduce the impact on animals and ecosystems,
– Discovering how plastic waste in the ocean will spread.
Diffusivity is a very important measure in oceanography that cannot be exactly evaluated, so instead it is estimated. It is fundamental that such estimates are accurate and reliable. Current estimators use ideas from physics and fluid dynamics, however, they prove inconsistent across data sets and require improvement.
In order to analyse and evaluate current estimators, we studied real ocean data. The data was collected by the Global Drifter Program who maintain over 1000 drifters globally. A drifter is a measuring instrument in the ocean that floats on the surface and tracks currents by satellite. Over 40 years, the Global Drifter Program has collected over 100 million observations. We focussed on information regarding location and velocity. For example, the graph below shows the velocity of a single drifter in both the longitudinal and latitudinal directions. This particular drifter is located in the North Atlantic Ocean and travelled from the east of Canada towards the west of Portugal over approximately 14 months.
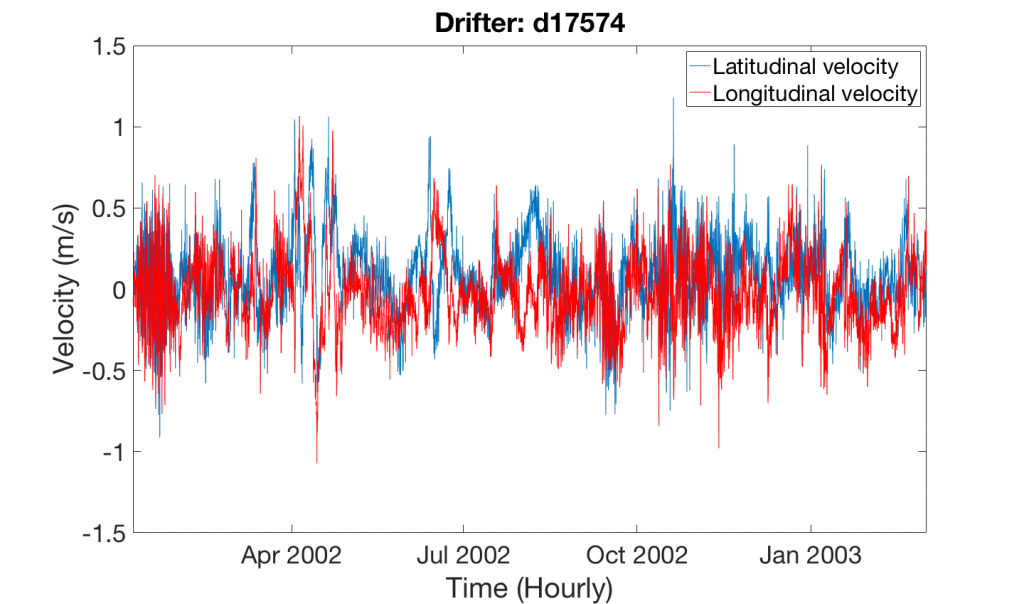
The above graph is called a time series, this is simply a sequence of observations over a series of time. Time series is an area in statistics that formed the foundation for my project. We modelled the ocean’s velocity as a particular time series model; an AR(1) process. This means the current value of velocity depends on the value it took in the previous time period plus some error term. The statistical properties of such a process helped form the estimator. It is worth noting that an AR(1) process is not an exact model for the ocean due to many external factors, but it is widely used in oceanography.
Spectral analysis is another area fundamental to calculating diffusivity. Specifically, we used a spectral density function to redefine our time series as a function of the contribution of each frequency. This is done using sine and cosine waves of different frequencies and identifying how well they contribute to our time series. The frequency can increase to infinity so we estimate the spectral density using a finite function of frequency; the periodogram.
Using the physical definition of diffusivity, algebraic manipulation and AR(1) statistical properties, diffusivity can be reformulated in terms of something estimable; the spectral density function. This gives us a periodogram-based estimator of diffusivity.
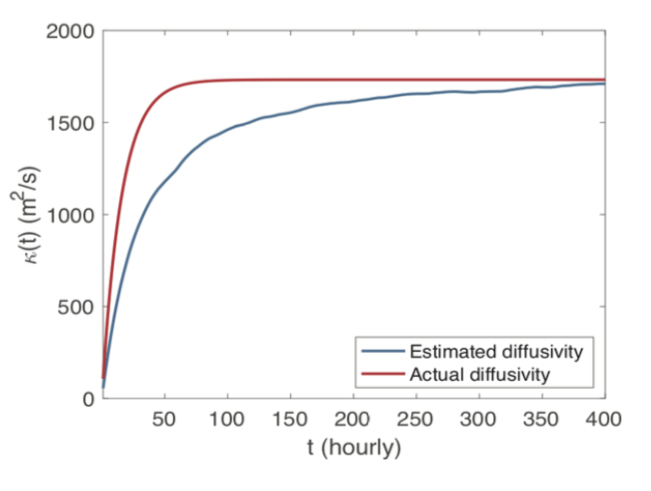
Firstly, we simulated data from an AR(1) process since the diffusivity of this process exists and can be exactly derived – this is the only case where we can compare our estimate to the actual diffusivity. The graph below shows the exact diffusivity (y-axis) of an AR(1) process (red) against our estimate applied to the simulated data (blue). The estimate follows a similar pattern to the actual diffusivity but takes longer to reach a steady state. This is to be expected as we know the estimate improves with the number of samples. However, the estimate reaches a value close to the actual diffusivity at the last time point and this is the value we are interested in. These results demonstrate that the estimator works well.
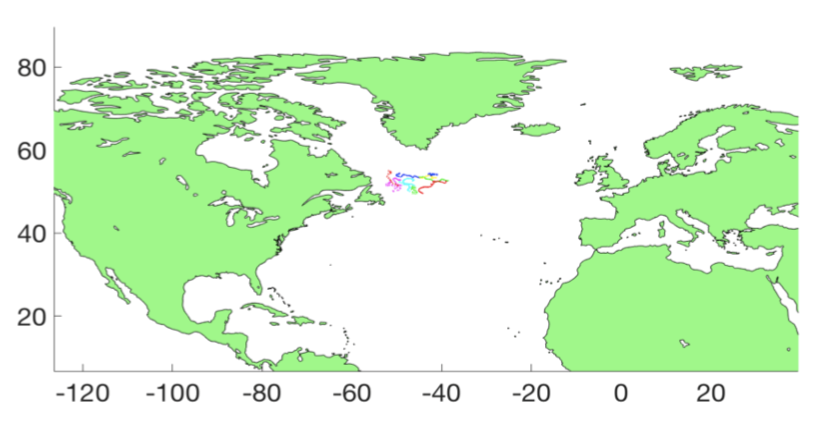
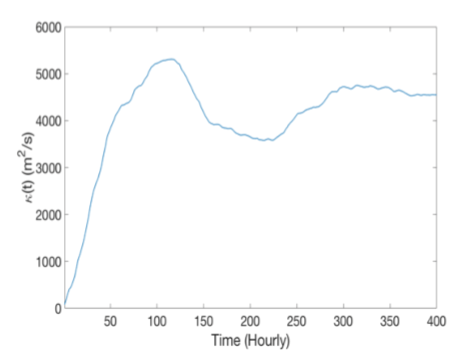
We then moved on to looking at real data from the Global Drifter Program, specifically we studied 11 drifters in the North Atlantic Ocean (see below). We observed these drifters over 400 hours at hourly intervals. Firstly, we found the estimated diffusivity of each drifter over the time period, but these values don’t have much meaning. By averaging the estimate for each drifter, we have found an estimate for this part of the ocean which is more purposeful. Additionally, we found diffusivity increases rapidly and then steadies out in a similar fashion to the AR(1) process – this supports the idea that the AR(1) process is a suitable model for the ocean.
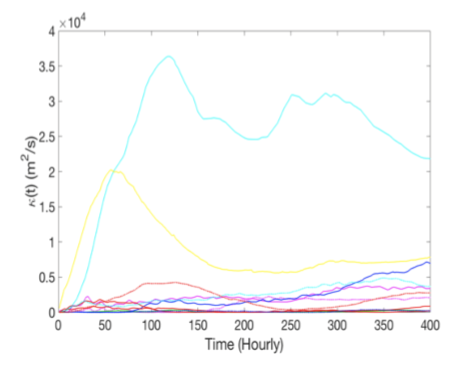
In summary, we know that diffusivity requires estimating because it cannot be exactly evaluated. To formulate our estimator, we model the ocean as a statistical AR(1) process where the value of the velocity now, depends on the value in the previous time period and we found that the estimate for the AR(1) process is comparable with the real data. To find out more, you can view my academic poster for this topic