There are a couple popular universes out there like the MCU and its multiverse, and Zuckerberg’s Metaverse. My personal favourite however is actually a universe of R packages.
This post is by no means a tutorial for the tidyverse. Nor is it an introduction to these packages or style of coding using R. Instead, this is just a compilation of my favourite features of the packages that will hopefully convince you of its power and convert you to the tidy side.
- What is in the tidyverse?
- Tibbles!
- Pipes & Purrr
- A few (more) of my favourite things
1. What is in the tidyverse?
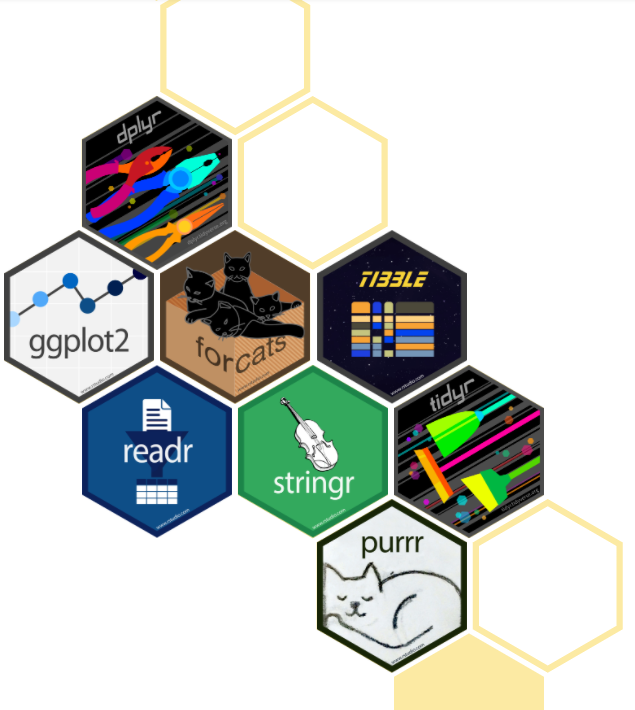
The tidyverse is a collection of R packages designed by Hadley Wickham for data science. It includes packages useful for loading, wrangling, modelling and visualising data, and a couple that make programming in R so much better. When you install and load the tidyverse, the following core packages will be loaded:
install.packages("tidyverse")
library(tidyverse)- readr – to import tabular data
- tibble – the better* dataframe
- dplyr – for data manipulation
- tidyr – to make data tidy
- ggplot2 – for data visualisation
- purrr – for functional programming
- stringr – for string manipulation
- forcats – for factors
There are also a couple other packages that are also installed for working with specific types of vectors, importing other data types and for modelling.
2. Tibbles!
I must start this section by addressing the * I’ve included so far. The tidyverse developers themselves describe it as an opinionated collection of R packages on the website. So when I say that tibbles are better than data frames, that’s just my opinion as someone who has drunk the Kool-Aid and loves it.
If you’ve ever used the data.frame or data.table, unless you’ve completely mastered using them, you may agree with me that it can be a bit confusing remembering how many commas are needed, whether to use square brackets or parentheses, if something is being done in place or if you need to make a copy. A tibble is “a modern reimagining of the data.frame”. The developers put it nicely when they said that tibbles are lazy and surly data.frames: they do less and complain more.
3. Pipes & Purrr
When you’re trying to manipulate data, or doing analysis that isn’t super simple, it’s very likely that you’ll end up with nested functions. Here’s a simple example: you want to create a table of random numbers using different distributions and then add a column for a new distribution.
There are a couple ways to approach this: you could create a new variable (or overwrite the variable) at each step. Or you could use pipes. Among other things, piping saves you having to rewrite variable names, avoid nested function calls and makes code look so much more elegant. The pipe operator %>% is included when you install the tidyverse.
#both bits of code do the same thing

no_pipe = tibble(N = rnorm(10), E = rexp(10))
no_pipe = mutate(no_pipe, G = rgamma(10,1))

with_pipe =
  tibble(N = rnorm(10), E = rexp(10)) %>%
  mutate(G = rgamma(10,1))
If you want to take it to the next level, the package magrittr includes several other piping operators. My personal favourite is the assignment pipe %<>% which allows you to modify data in place.
4. A few more of my favourite things
As I said at the start, this is by not meant to be a comprehensive introduction to the tidyverse. Now that I’ve introduced a few of the basics, here are a couple other features (each of which could have its own post really) that make these packages so great:
Tibbles and what they can store
With tibbles, the columns type does not have to be a core data type. As well as the basics (integer, numeric, string, factor, logical), cells can contain vectors, lists, tibbles or almost anything really. And you can move between complex and simple data types using functions in the package dplyr has useful functions to nest, unnest and pivot data to the desired shape without much hassle.
Purrr, map and all its variants
You can make code a lot easier to read by using map functions to replace for loops. This is really helpful when you have nested tibbles that you want to perform a set of operations over.
Tidyselect and dplyr
The group_by function from dplyr and the many helper functions included in the package tidyselect make summarising and manipulating groups of data super straightforward.
Grammar of Graphics
I’ll admit that when you just start using ggplot2 in R, it may seem really complicated, especially when compared to the base graphics package included in R. But once you get a hang of the basics, you can create some spectacular visualisations.
R Markdown
R Markdown is an amazing way to combine code, results and commentary and save them as accessible file types. It is really good as both a lab notebook to keep track of your work and thoughts, and as a means of communicating every step of the analysis process.
Learn More
- This online book (as well as lots of practice) is where I learnt most of what I know about the tidyverse.
- A really helpful cheatsheet for ggplot2
Purrrrrrr