 |
close
window to return
|
Issue 1, January 1998, pp.4-5.
Health
inequalities - today's biggest issue for public health
Margaret Whitehead
Life and
death over the century
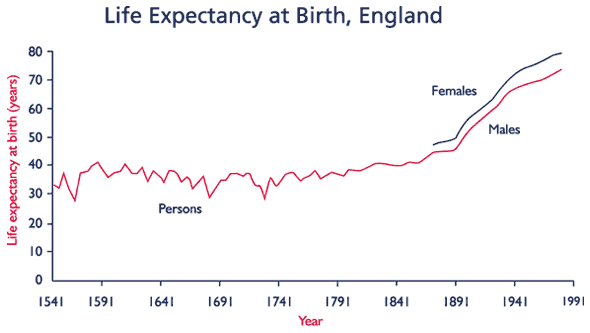
Over the course of this century, there have been dramatic reductions in
death rates in all industrialised countries, particularly for babies and
children. This shows up, for example, in the rise in life expectancy at
birth in England, which doubled from under 40 years at the end of the
19th century, to 75 years for men and 80 years for women by 1995, as illustrated
in Figure 1.
Figure 1

Source: Wrigley and Schofield (1989), Office for National Statistics
These average figures for life expectancy mask the very different
experiences of various groups within the population over the decades.
Britain has a long tradition of collecting and analysing national deaths
data in relation to social and economic circumstances. Figure 1 in Sally
Macintyre's article (see Sally Macintyre's article, Health Variations
Programme Newsletter, Issue 1, pp. 6-7) shows an analysis from the Registrar
General of the situation in the mid-19th century, comparing average age
at death in towns with figures for rural areas and for different classes.
The poor health in the urban compared with rural areas can be seen, but
also the enormous differences - of up to 30 years in some towns - between
the average age at death of labourers' families and those of the "gentry."
Despite being crude and unadjusted, these statistics on health inequalities
were used very effectively by the Victorian public health campaigners
to highlight the scale of the loss of life due to overcrowding, dangerous
working conditions, poverty and hunger. For example, Edwin Chadwick in
1842, estimated that:
"The annual loss of life from filth and bad ventilation is greater than the loss from death or wounds in any wars in which the country has been engaged in modern times."
Around the same time,
William Farr, the first Superintendent of Statistics in England, calculated
that there was, as he put it, "an annual sacrifice of children's
lives in the 151 unhealthy districts in the Kingdom" of almost 65,000
deaths per year.
Such evidence helped to trigger public works to improve housing and sanitation
and social policy developments, which contributed to the transformation
in the population's health, including the rise in life expectancy seen
in Figure 1.
History repeats itself
Similar concerns about the health divide between rich and poor have surfaced
whenever social and economic circumstances have worsened. In the economic
depression of the 1930s, it was estimated that 50,000 excess deaths were
occurring each year in the deprived and high unemployment regions of the
North of England and Wales because of intense poverty in these areas.
The problem was compounded among women by the tendency for mothers to
make sacrifices in terms of food and health care to provide for their
families. When poverty and unemployment started to rise again in the 1980s,
attention once more turned to the impact on health. The current concern
in the 1990s can in part be traced to several key trends.
First, more intensive monitoring in Europe and North America has demonstrated
that the health differentials between different groups in the population
are still substantial, not trivial. Even today, the chances of good health
and long life vary greatly across society. It is not uncommon to find
a gap in life expectancy of anything between five and ten years between
people at the top and those at the bottom of the social scale. Not only
is life shorter for people who experience less advantaged circumstances,
but they also tend to be exposed to greater risks of illness and disability
during their life and to have fewer opportunities to promote their health
to its full potential (see Chris Power's article, Health Variations Programme
Newsletter, Issue 1, pp. 14-15). This results in more disadvantaged groups
in the population spending between nine and thirteen more years in poor
health before they die than prosperous groups, as measured by years of
"healthy life expectancy."
Second, it appears that the situation may be getting worse in some cases,
as the gap in health widens between those at the top and bottom of the
social scale. This is not always due to a general improvement in health
for all groups, though at a more rapid pace for some. In certain circumstances,
the health gap has widened because of a stagnation or even a deterioration
in health for the most disadvantaged groups or areas, at the same time
as improvements were occurring for others.
Third, these health
trends have been unfolding against a backdrop of great socio-economic
and demographic change. This has included the growth of inequalities in
society on several fronts, accompanied by an absolute deterioration in
socio-economic conditions for sizeable sections of the population. The
fact that these trends have been experienced by a wide range of countries
has moved the issue further up the international political agenda. The
World Health Organisation, the European Union and the World Bank are among
the international agencies which have identified health inequalities as
a priority for concerted action in the next decade.
Latest national evidence
To illustrate one aspect of the current picture in this country, some
of the latest evidence can be highlighted from the long series of national
death records dating back over 150 years. The latest analyses for England
and Wales using this database were published by the Office for National
Statistics (ONS) in September 1997. They show that a marked socio-economic
gradient in illness and death has not only persisted into the 1990s, but
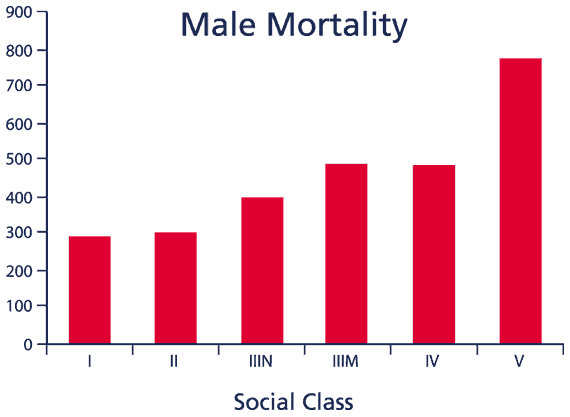
has in some cases widened over the past twenty years. Among working-age
men, death rates in the 1990s are almost three times higher in unskilled
manual workers than among professional men, an increase from a two-fold
difference at the beginning of the 1970s, as shown in Figure 2. Furthermore,
substantial differentials in mortality are not confined to the extremes
of the social scale, but show a step-wise increase with decreasing social
class.
Figure 2

Source: Drever et al (1997)
- Three-fold differential in all-cause mortality in 1991-93
- Rate in class V - 806 per 100,000
- Rate in class I - 280 per 100,000
Although most major causes of death show a similar social gradient, particularly
large differentials have developed for specific causes such as respiratory
diseases, lung cancer, accidents and suicide. This translates into a tragic
wastage of life. At ages 25 to 34, for example, about half the male deaths
are from external causes, such as accidents, suicide and homicide. The
strong social class gradients in these causes mean that if all men had
the favourable overall death rates of men in professional and managerial
jobs, then 40 per cent of all deaths in that age group would be prevented.
Such social class differentials are also evident for women.
Findings from the ONS Longitudinal Study, which has been tracking a 1
per cent sample of the population since 1971, show that life expectancy
at birth for the daughters of semi-skilled and unskilled manual workers
is now three years less than for those of professionals and managers:
77 years and 80 years respectively. In the 1990s, women aged 35-64 in
the less skilled social classes have death rates of 418 per 100,000, one
and a half times those in professional and managerial classes, for whom
rates are 270 per 100,000. There was clear evidence from this Longitudinal
Study that class inequalities in mortality among women had widened between
1981 and 1992, with women in non-manual occupations experiencing much
greater improvements in death rates than their counterparts in manual
occupations.
Further complexities in the patterning of health in the population are
now becoming apparent when interactions between geographic, ethnic, gender
and socio-economic factors are examined, and when a range of indicators
of health and well-being are employed, over and above the analyses based
solely on deaths (see articles by Sally Macintyre, Kate Hunt and James
Nazroo, Health Variations Programme Newsletter, Issue 1, pp.6-11).
Identifying and tackling the causes
The accumulating evidence demonstrates that the size of social differentials
in health varies over time and in different countries and points to the
conclusion that the observed health inequalities are not inevitable. Many
of the important underlying social, cultural and economic factors have
the potential to be influenced by deliberate public policy. The task facing
researchers now is to ensure that any action to tackle health inequalities
is informed by greater understanding of the underlying causes, pointing
the way towards the most effective strategies to bring about the desired
improvements in public health. The Health Variations Programme is a major
initiative which seeks to do just this.