Location of panel members
[ Back to Research Design ]The map below (Figure 3) shows the locations of the panel members plotted using their postcodes. This plotting reveals a distribution ‘shape’ which reflects the spread of cases of FMD in Cumbria (Figure 4).
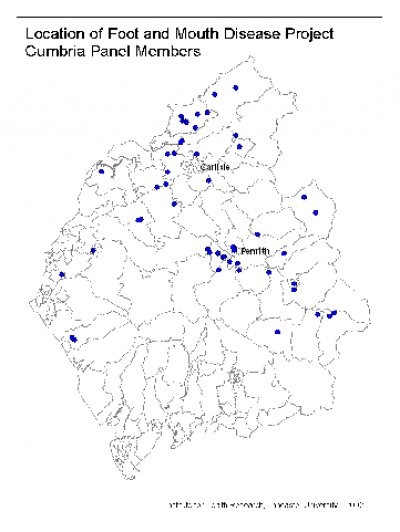
Fig 3 Location of Panel Members. Source: Lancaster study 2002
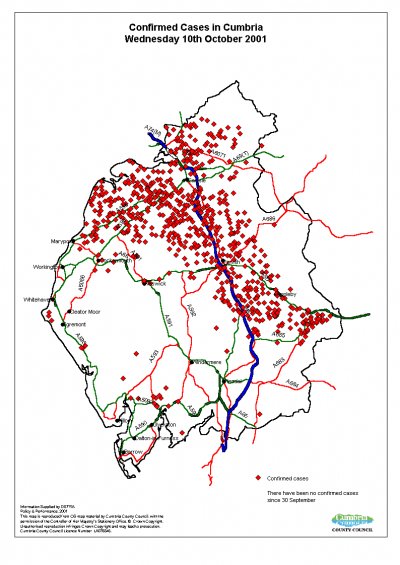
Fig 4 Spread of confirmed cases Source: DEFRA and Cumbria Inquiry 2002
Site Design by FractalWeb with the generous support of Cumbria County Council