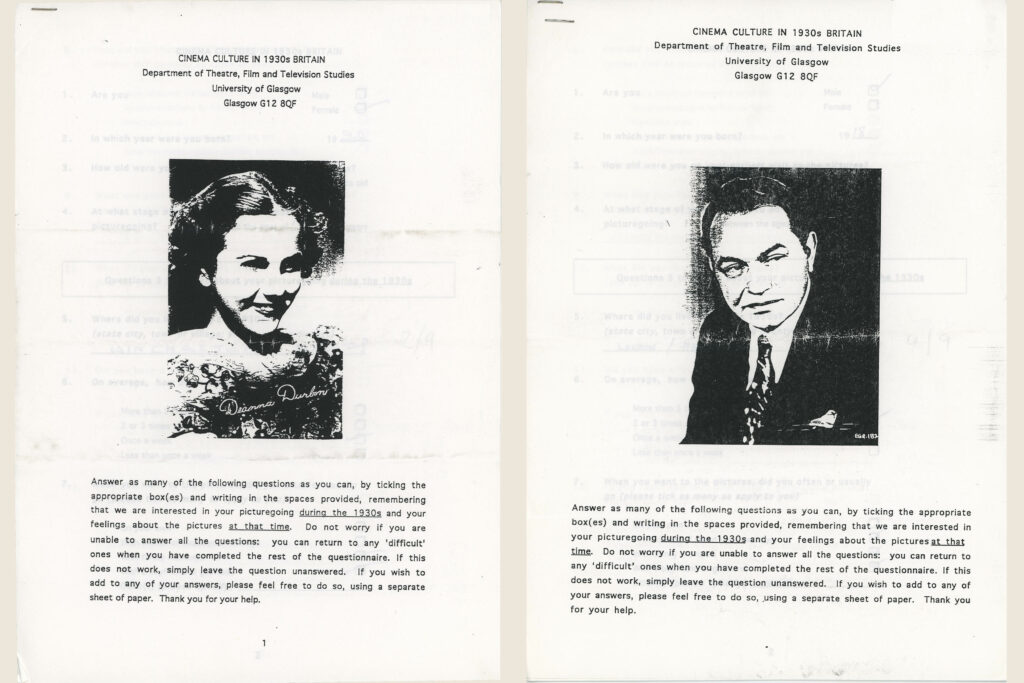
Last Autumn I posted an explanation of how the interviews conducted as part of Cinema Culture in 1930s Britain were planned and managed (‘Annette Kuhn talks about a key aspect of CCINTB’s research design’, 23 October 2020). The other significant element in the project’s memory work with 1930s cinemagoers was a questionnaire survey. The survey was not part of the original plan, but came about as a result of the overwhelming response received to calls for potential interviewees. Hundreds of letters, enquiries, and offers of information poured in from all over Britain, and it became apparent that the project had generated much more interest than could be accommodated through interviews alone. Our funder, the Economic and Social Research Council, agreed to the plan to invite those correspondents who were not selected for interview to take part in a postal questionnaire survey.
The questionnaire was kept short and simple, and designed–through the choice, framing and ordering of questions–to stimulate recall of events and experiences of more than sixty years earlier. Questionnaires were sent out in two batches: 129 in May 1995 and 97 in December 1995. Of these 226 questionnaires, a total of 186 were returned, representing an encouraging response rate of over 82 per cent. Questionnaires were processed using SPSS, a software package widely used in the social sciences for quantitative data analysis.
Three-quarters of the respondents found out about the project through announcements in a local newspaper or a specialist publication for the elderly (Table 1, below). Although no gender balance was planned or intended, respondents divided themselves more or less equally as to gender: of the 186, 91 (49 per cent) were male and 95 (51 per cent) female. Some six in ten were born between 1915 and 1924, the median year of birth being 1922 (Table 2). Nearly one-third of all respondents had lived in the southeast of England during the thirties (Table 3), and the majority lived in larger towns and cities as opposed to small towns and rural areas.
Just over half of the respondents finished their full-time education at the age of fourteen or below: that is, at the minimum school-leaving age for their generation, for whom education beyond elementary school was a minority experience. The women, however, were rather more likely than the men to have received a secondary education. At the end of their full-time education, the largest single group of men and women entered jobs classified as skilled: these included secretarial and clerical occupations (accounting for more than 27 per cent of all respondents) as well as certain types of administrative and craft jobs. A substantial additional group found work in sales occupations, and another group in agriculture and other primary occupations. In general, as might be expected of a self-selected sample, the people taking part in this survey appear to have had slightly more formal education, and to have worked in jobs requiring greater skill and/or more training, than would be expected in their age group as a whole.
The completed questionnaires are in the process of being scanned, and a number are currently viewable on the CMDA website via the home pages of selected CCINTB participants [example – Myra Schneiderman].
For a copy of the questionnaire and a report of the findings of the survey, see Annette Kuhn, ‘Cinemagoing in Britain in the 1930s: report of a questionnaire survey’, Historical Journal of Film, Radio and Television, vol. 19, no. 4 (1999), pp. 531-543.
Tables:
Table 1 – Mode of Contact
| n | % | |
| Personal contact | 13 | (7.1) |
| Local radio | 4 | (2.2) |
| Newspaper (e g Manchester Evening News) | 75 | (41.2) |
| Specialist press (e g Mature Tymes) | 62 | (34.1) |
| Local history/film society | 4 | (2.2) |
| Unknown | 24 | (13.2) |
Table 2 – Year of Birth
| Male
n (%) |
Female
n (%) |
All
n (%) |
|
| 1903-1914 | 6 (7.0) | 10 (10.5) | 16 (8.6) |
| 1915-1924 | 51 (56.0) | 59 (62.1) | 110 (59.1) |
| 1925-1934 | 34 (37.0) | 26 (27.4) | 60 (32.3) |
| Median y.o.b | 1923 | 1922 | 1922 |
| Range | 1906-32 | 1903-34 | 1903-34 |
Table 3 – Region of Domicile in the 1930s
| n (%) | |
| Southwest England | 14 (17.5) |
| Southeast England | 61 (32.8) |
| East Anglia | 34 (18.3) |
| Midlands | 12 (6.5) |
| Yorkshire/Humberside | 9 (4.8) |
| Northwest England | 22 (11.8) |
| North England | 5 (2.7) |
| Scotland | 11 (5.9) |
| Northern Ireland | 1 (0.5) |
| Wales | 15 (8.1) |
| Unknown | 2 (1.1) |
