
Ella Mann-Andrews
Several studies have evidence that there is a correlation between the circadian rhythm and the cell cycle in mammalian cells. However, data analysis in the PNAS paper of the data collected suggested no correlation. Using MODA analysis (a matlab program) the strength of this correlation will be tested at a range of frequencies. The result obtained demonstrate that there is indeed minimal-to-no coherence at any frequency at 31 degrees. There is, however, evidence that – in the case of a 37 degree system – correlation between the two signals.
Ella Mann-Andrews
Intro: Testing synchronicity of oscillating systems
The aim of my Summer Internship with the Physics Department was to examine the levels of synchronicity between two biological signals, using a Matlab programme developed by Prof. Aneta Stefanoska et al. called MODA. Specifically, I will figure out the whether the synchronis between two cell cycles and circadian rhythms was present in the data supplied by M. Yeom et al. The different signals are analysed separately in pairs to determine synchronicity.
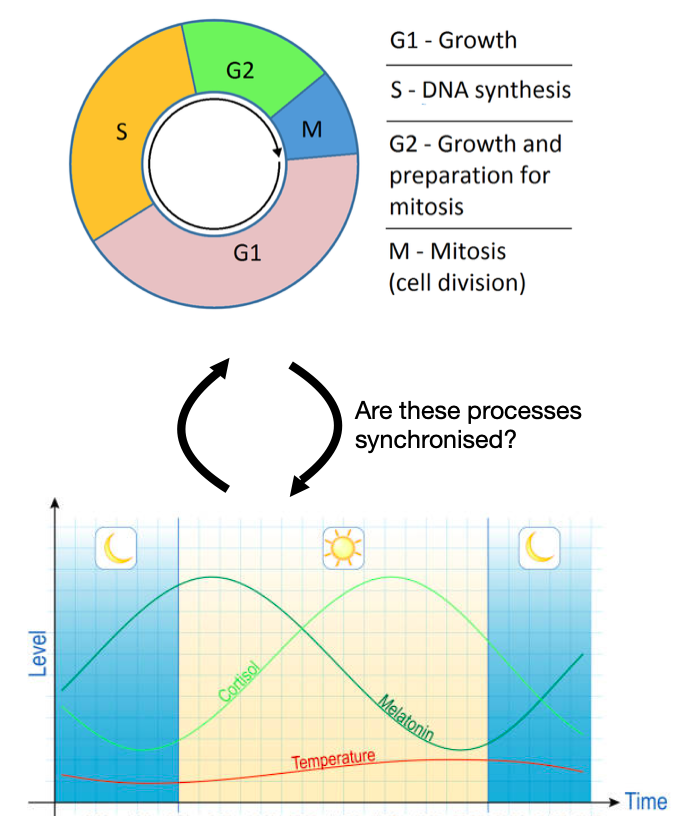
Figure 1: The objective for this research was to examine data and test the for any evidence of synchroniscity between the cell cycle and circadian rythmn.
Methodology: How to find Coherence. (hover over the stages to find out more)
Step 1: Data Aquisition
Data from M. Yeom et al study was used for this analysis. I received the data from the studies conducted by M.Yeom and their team by email in cvs files.
Step 2: Pre-processing for MODA
Pre-processing of the data using MODA eliminates any other trends in the data and isolates the fluctuations. (As shown in figure 2)
Step 3: Anaylsis
This involves the creation of the plots in the 'Results' section. The signals are anaylsed using the MODA programme, which allowed the frequencies of highest correlation to be plotted.
Stage 4: Conclusions
The final plots produced by MODA allow conslusion to be drawn about the possiblity of synchonisation at different frequencies.
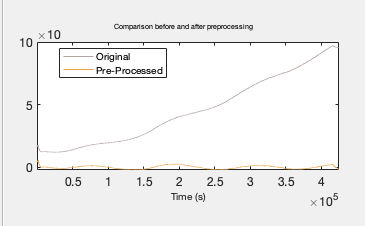
Figure 2: shows the first step of the MODA program's data analysis.
How does MODA work?
(!Physics/Maths!)
Well, MODA (Multi-scale Oscillatory Dynamics Analysis) is a computer program. I used the 'Wavelet Phase Coherence’ Mode in MODA, this allowed the correlation at all frequencies to be calcualted simultanouesly, this is superior to FFT (Fast-Fourier Transforms) as these only check at one frequency.
Results
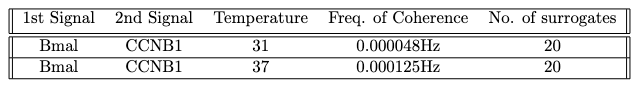
Overall, the data analysed showed some evidence of correlation at specific frequencies at both of the temperatures tested. However, overall this data was quite inconclusive. At frequencies of x10^-5, coherence was technically statistically significant, this is only with 20 surrogates however - so these readings could have been random in nature.
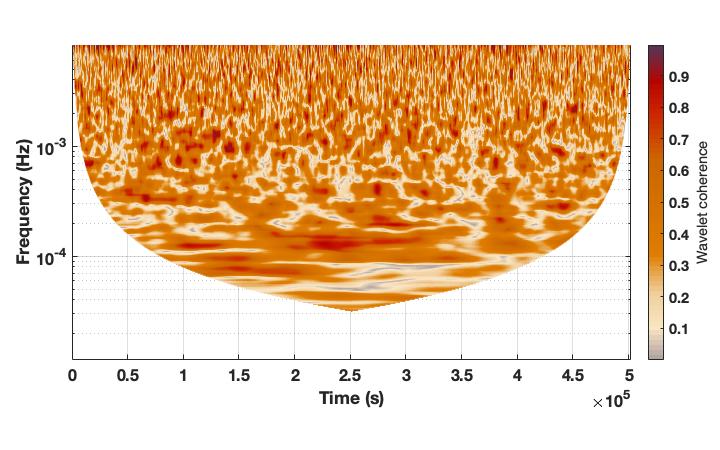
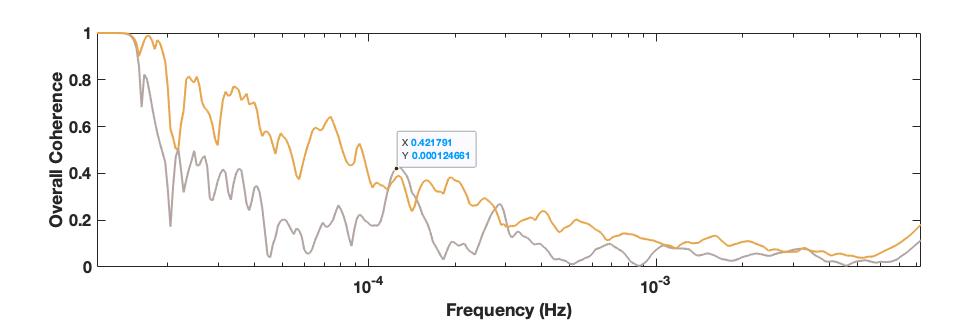
Figure 5: Results at 37 degrees
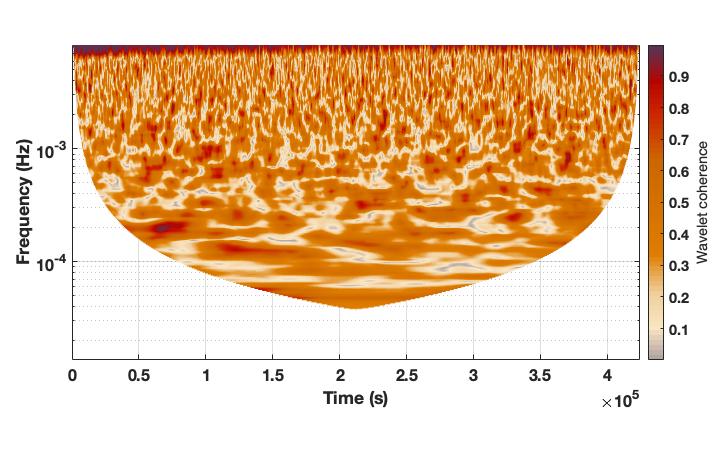
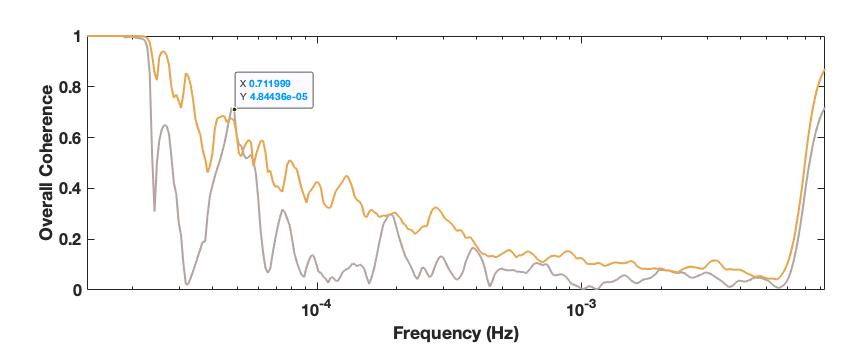
Figure 6: Results for 31 degrees
Don't be scared by the first graph, this is the readout from the program after analysis. Hover over these to see at which frequency coherence was detected observed.
When the gray line, the data line, is higher than the orange line, which is a test with a large number of random samples "surrogates", there is the possiblity of coherence at those frequencies.
Reasons this requires further study for confirmation
Due to time and my computing limitations (just used my laptop), I could only use 20 surrogrates for my anaylsis. I would love to run this analysis with approx. 200 surrogates, allowing for a higher level of certainty in the findings.

References
[1] = M. Yeom et al. Circadian-independent cell mitosis in immortalized fibroblasts. PNAS, pages 1–6, 2010.
[2] = Aneta Stefanovska, Julian Newman, Gemma Lancaster. Multiscale Oscillatory Dynamics Analysis - User manual v1.1. pages 1–25, 2018.
Acknowledgements
A lot of credit must be given to Dr Aneta Stefanoska and her team who created the MODA program for the anaylsis of these types of signals. Also to M. Yeom et al who allowed me access to the data for the synchronisation analysis.
Slide 1 image (max 2mb)
Slide 1 video (YouTube/Vimeo embed code)
Image 1 Caption
Slide 2 image (max 2mb)
Slide 2 video (YouTube/Vimeo embed code)
Image 2 Caption
Slide 3 image (max 2mb)
Slide 3 video (YouTube/Vimeo embed code)
Image 3 Caption
Slide 4 image (max 2mb)
Slide 4 video (YouTube/Vimeo embed code)
Image 4 Caption
Slide 5 image (max 2mb)
Slide 5 video (YouTube/Vimeo embed code)
Image 5 Caption
Slide 6 image (max 2mb)
Slide 6 video (YouTube/Vimeo embed code)
Image 6 Caption
Slide 7 image (max 2mb)
Slide 7 video (YouTube/Vimeo embed code)
Image 7 Caption
Slide 8 image (max 2mb)
Slide 8 video (YouTube/Vimeo embed code)
Image 8 Caption
Slide 9 image (max 2mb)
Slide 9 video (YouTube/Vimeo embed code)
Image 9 Caption
Slide 10 image (max 2mb)
Slide 20 video (YouTube/Vimeo embed code)
Image 10 Caption
Caption font
Text
Image (max size: 2mb)
Or drag a symbol into the upload area


Image description/alt-tag
Image caption
Image link
Rollover Image (max size: 2mb)
Or drag a symbol into the upload area
Border colour
Rotate
Skew (x-axis)
Skew (y-axis)
Image (max size: 2mb)
Or drag a symbol into the upload area
Image description/alt-tag
Image caption
Image link
Rollover Image (max size: 2mb)
Or drag a symbol into the upload area
Border colour
Rotate
Skew (x-axis)
Skew (y-axis)
Image (max size: 2mb)
Or drag a symbol into the upload area
Image description/alt-tag
Image caption
Image link
Rollover Image (max size: 2mb)
Or drag a symbol into the upload area
Border colour
Rotate
Skew (x-axis)
Skew (y-axis)
Image (max size: 2mb)
Or drag a symbol into the upload area
Image description/alt-tag
Image caption
Image link
Rollover Image (max size: 2mb)
Or drag a symbol into the upload area
Border colour
Rotate
Skew (x-axis)
Skew (y-axis)
Image (max size: 2mb)
Or drag a symbol into the upload area
Image description/alt-tag
Image caption
Image link
Rollover Image (max size: 2mb)
Or drag a symbol into the upload area
Border colour
Rotate
Skew (x-axis)
Skew (y-axis)
Image (max size: 2mb)
Or drag a symbol into the upload area
Image description/alt-tag
Image caption
Image link
Rollover Image (max size: 2mb)
Or drag a symbol into the upload area
Border colour
Rotate
Skew (x-axis)
Skew (y-axis)
Image (max size: 2mb)
Or drag a symbol into the upload area
Image description/alt-tag
Image caption
Image link
Rollover Image (max size: 2mb)
Or drag a symbol into the upload area
Border colour
Rotate
Skew (x-axis)
Skew (y-axis)
Image (max size: 2mb)
Or drag a symbol into the upload area
Image description/alt-tag
Image caption
Image link
Rollover Image (max size: 2mb)
Or drag a symbol into the upload area
Border colour
Rotate
Skew (x-axis)
Skew (y-axis)
Image (max size: 2mb)
Or drag a symbol into the upload area
Image description/alt-tag
Image caption
Image link
Rollover Image (max size: 2mb)
Or drag a symbol into the upload area
Border colour
Rotate
Skew (x-axis)
Skew (y-axis)
Image (max size: 2mb)
Or drag a symbol into the upload area
Image description/alt-tag
Image caption
Image link
Rollover Image (max size: 2mb)
Or drag a symbol into the upload area
Border colour
Rotate
Skew (x-axis)
Skew (y-axis)